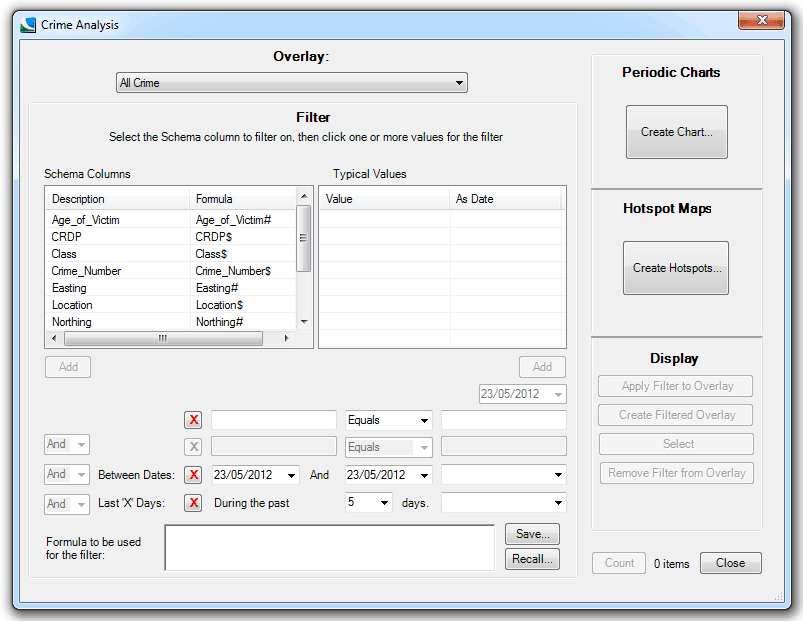
Display the Crime Analysis dialog and select the overlay which contains the crime data from the Overlay drop-down list:

The Schema Columns panel will automatically populate with the Description and Formula of each schema column of the selected overlay.
Note that the Crime Analysis dialog is re-sizable, and the column widths can be changed to read the information more clearly.
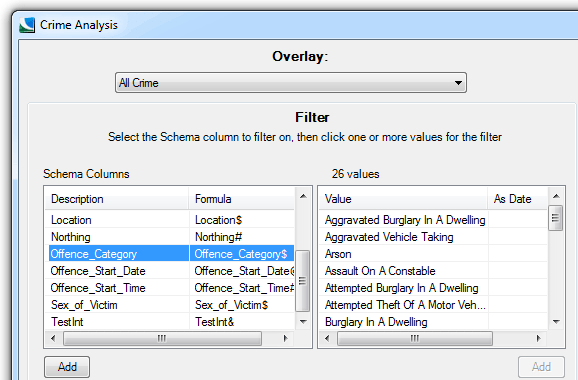
When you select a schema column by clicking on a row in the Schema Columns list the Typical Values panel is populated with every value found in that column and the panel title will change to show the total number of values. This is to assist you in filtering the types of crime you intend analyzing. If you select a column which contains unique values (e.g. Incident ID) then the list will be populated with as many unique values as there are items in the overlay. This could take a considerable time and is to be avoided where possible.
Filters are made up of two halves of a formula. The left-hand component is the schema column to be examined, and the right-hand component is a value to be found in that column. When processing, the system will only include crimes where the result of this formula is true.
To build a filter, select the schema column in the list in the left-hand panel and click the Add button below the Schema Columns list.
Select the value from the list in the right-hand panel and press the Add button below the Values list.
Alternatively, instead of clicking Add you can simply double-click on the list to place the column or value directly into the filter.
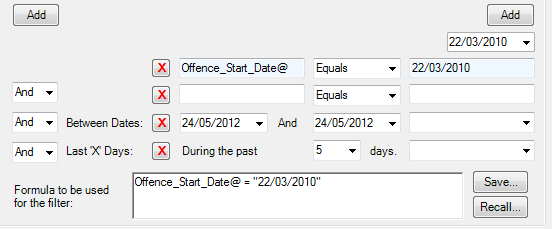
The date drop-down box below the right-hand Add button is used if a date column is selected in the left-hand pane, it will default to today's date but can be set to any required date, this date will then be shown in the Formula box, for example:
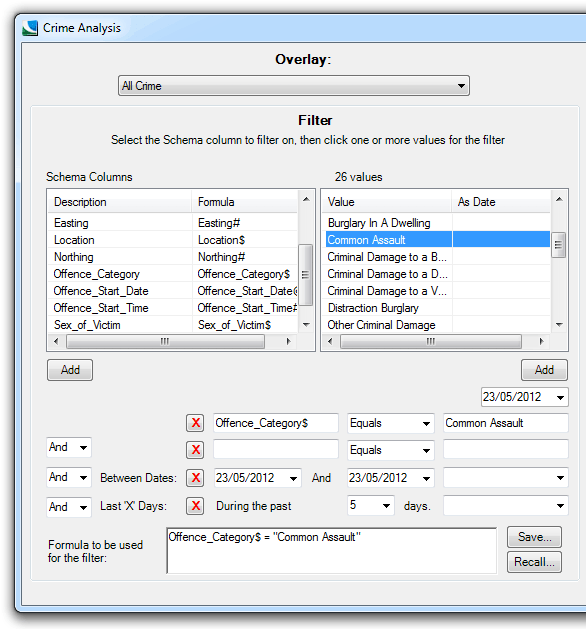
The centre box has a drop-down so that comparison values can be selected, the default is Equals but this can be changed to Not Equal, Greater Than or Less Than.
The example below sets a filter to only process incidents relating to “Common Assault”.
Optionally a second clause can be added to the filter. Click the cursor in either the left or right hand “second clause” boxes, the box will change to a pale blue and the cursor vertical bar will show to indicate that the box has the “focus” of the Add buttons. Build the second clause in the same way as the first.
Where there are two clauses in a filter you can use the And and Or options (set from the And/Or drop-down box) to choose whether items must pass either or both clauses. Click the red X button when you wish to remove a second clause from the Formula to be used for the filter text box.
Take care when creating filters with two clauses. The filter will be applied to each item in turn, not to the dataset as a whole. Below is an example of a filter which will give you unexpected results:
Offence_Category$ = ‘Burglary’ And IncidentType$ = ‘Arson’
This will not, as you might expect, permit both burglary and arson incidents to pass the filter. In fact it will permit nothing to pass the filter, because there will be no single incidents which are recorded as both burglary and arson. That would be achieved using the Or option:
Offence_Category$ = ‘Burglary’ Or IncidentType$ = ‘Arson’
You should only use the And option where each clause of the filter uses a different attribute, for example:
Offence_Category$ = ‘Burglary’ And Status$ = ‘Closed’
The third clause, called Between Dates, allows a date range to be set for a schema column using the end drop-down box. Again this clause can be set to And or Or from the associated drop-down box.
The final clause that can be added is the Last 'X' Days which allows the past number of days to be entered and the schema column to be set. Again this clause can be set to And or Or from the associated drop-down box.
The following example shows the “Common Assault” filter shown previously but with a second clause to filter victims of less than 21.

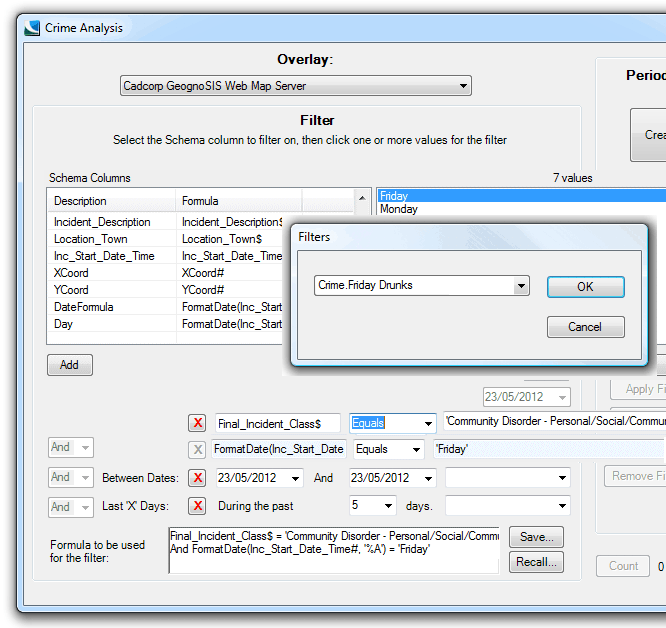
You are not limited to the filters which can be created using the Crime AnalySIS toolkit. Any filter previously created in Map Modeller can be recalled into the filter tool. This is useful when you regularly perform a task based on the same dataset, such as weekly or monthly reports. Simply click the Recall… button and select the filter from the drop down list.
Below is an example of a filter for incidents of drunkenness on Fridays:
Send comments on this topic.
Click to return to www.cadcorp.com
© Copyright 2000-2017 Computer Aided Development Corporation Limited (Cadcorp).