Attendance times analysis produces, for data passing the currently set filters, a report showing the distribution of attendance times for the 1st and 2nd appliance at the scene.
This analysis can be done on historic data or the output of a model.
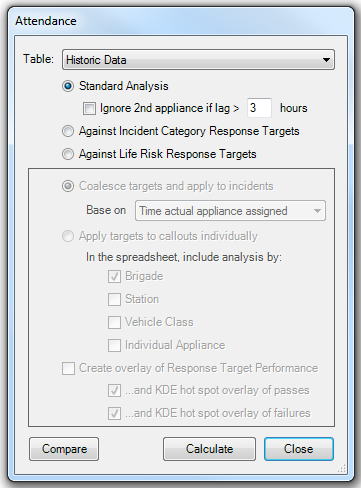
Attendance (time analysis) dialog
Note: Standard Analysis considers the first two appliances to arrive at an incident within the filtered dataset. Because different vehicle classes can have different "In Attendance" targets a warning will be raised if the data being analysed contains more than one vehicle class:
To get an analysis of 1st and 2nd ‘pumps’ arriving at incidents the filter should be set to include ‘pumps’ only.
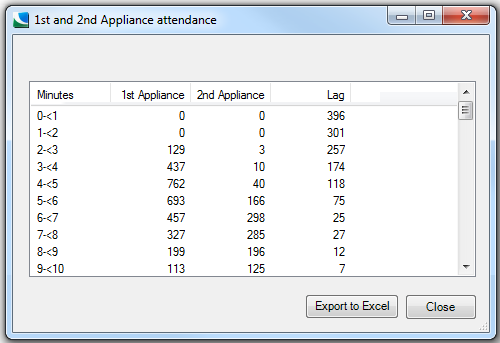
On-screen output of Attendance Analysis
The above output shows that for 129 incidents in the analysis the 1st appliance arrived in between two and three minutes, for 437 incidents the 1st appliance arrived in between three and four minutes etc.
The Export to Excel button will create an Excel workbook for this output which contains:
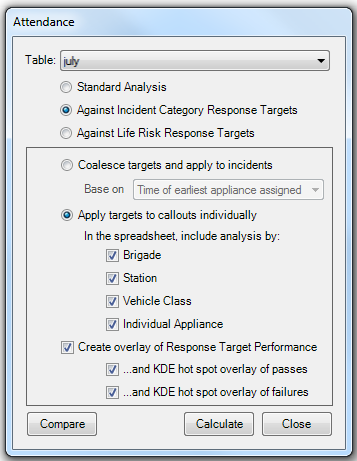
Targets can be coalesced and applied to incidents in the Against Incident Category Response Targets and Against Life Risk Response Targets analysis options.
Coalesce - An incident ‘passes’ only if all the targets relevant to that incident are passed. Workbook comparison also supports this.
Therefore the first and subsequent vehicles must have passed the response target to be a total pass for the incident being successfully handled; but not if one vehicle arrives at the incident and the others do not arrive in the response target time.
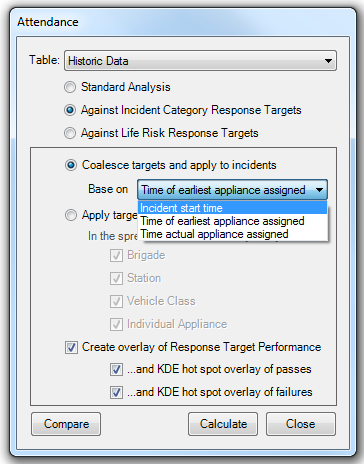
The pass time for each vehicle is calculated from the mobilisation data where the user has the choice to model from incident start time (so approximate ITN routecost + reaction time), or the time the earliest vehicle is assigned, or the actual appliance assigned (i.e. mobilised).
Select the Coalesce target to be applied to incidents based on:
Response-based analysis can be performed on targets defined for Incident Categories or Life Risks. The figure below shows output where the following targets were set:
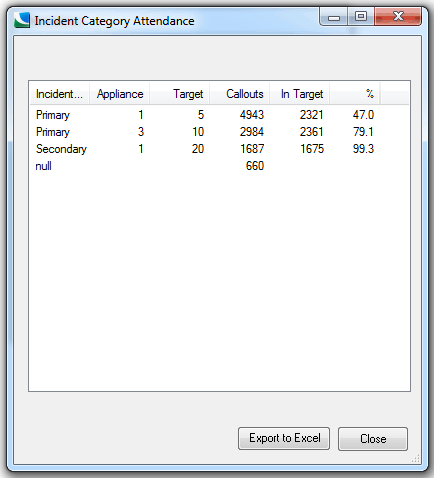
Response Category-based Analysis
In the above example, the performance of the 1st appliance arriving for Primary incident types measured against the 5 minute target was 47%.
The ‘null’ row shows how many incidents in the analysis fell outside the categories of ‘Primary’ and ‘Secondary’.
An overlay of the full Life Risk analysis can also be created by checking the Create overlay of Response Target Performance tickbox option on the Attendance form. An example is shown below.
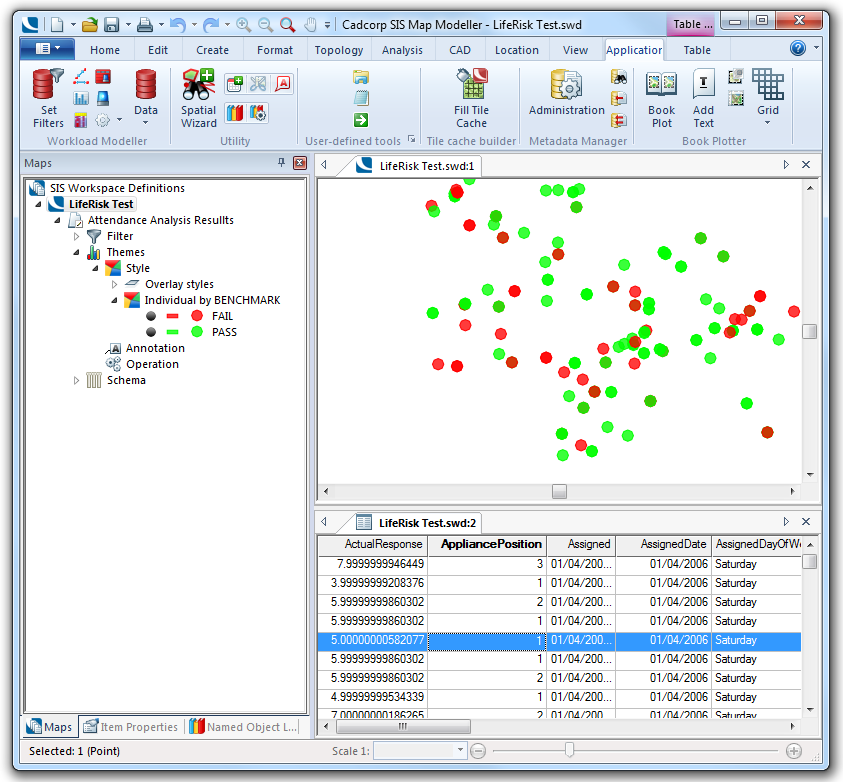
Overlay of Response Target-based Attendance Analysis
The creation of KDE hotspot overlays with predefined parameters has been included in the Against Incident Category Response Targets and Against Life Risk Response Targets analysis options to improve visualisation.
KDE hot spot options in Analyse Attendance
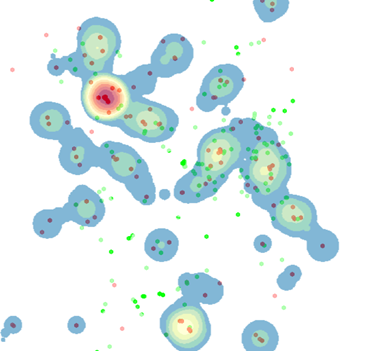
Selecting all three options:
will create the following overlays:
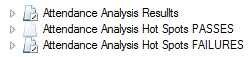
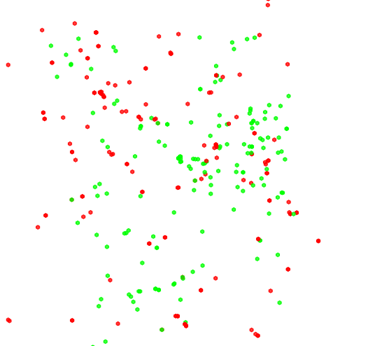
Overlays created by Analyse Attendance
Attendance Analysis Results
Attendance Analysis Results with
Attendance Analysis Hot Spots Failures
If you want to compare a base case with a particular scenario click Compare.
The Compare Workload Modeller Workbooks dialog will be displayed:
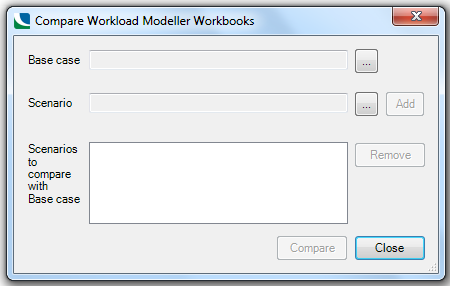
Click the Base case ... button to navigate to the Base case workbook.
Click the Scenario ... button to navigate to the Scenario workbook.
The descriptions of each selection will be displayed:
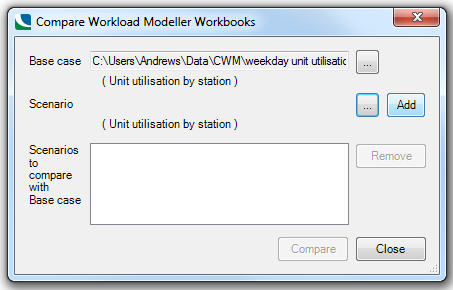
Click Add to accept the Scenario:
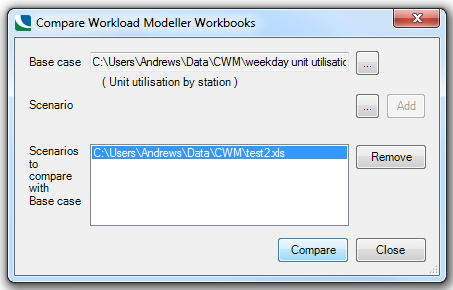
Click Compare.
Navigate to the location to save the output file.
A progress message will be shown at the bottom of the dialog, i.e.
Loading base case
Comparing workbooks...
A confirmation message will be shown when the Comparison is complete.
Send comments on this topic.
Click to return to www.cadcorp.com
© Copyright 2000-2017 Computer Aided Development Corporation Limited (Cadcorp).