Route Cost
Create a route cost risk map based on the least-cost route to geography unit centroids or point co-ordinates.
Data for this is extracted from a set of departure points using a defined routing expression applied to hittable/editable topology.
Click Applications > Risk and select Route Cost. 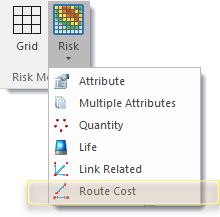
This opens the Route Cost-risk wizard.
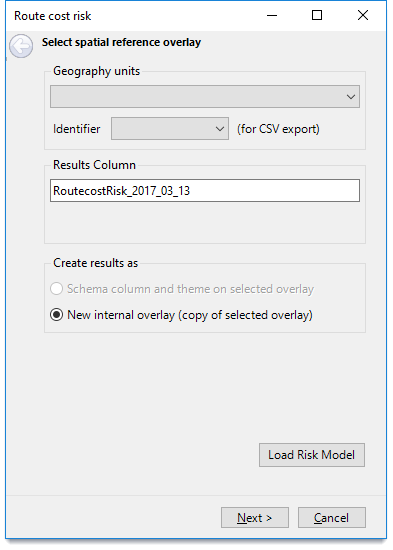
1. Geography units
- Select the overlay containing the points (ideally from which routes are to be calculated, e.g. an overlay of Fire station locations.)
- Select the overlay that will receive the thematic result of the risk calculation.
- This could be the grid overlay created in the Grid command.
For example:

Identifier
Here an attribute containing the geography units’ Identifier can be selected.
This should be a unique value per unit (e.g. super output area name, ward name etc) and is used in the export of the full result set;i.e. the costs and distances from all ‘from’ points to all ‘to’ points.
If no attribute is selected the CSV export will not be available on the theme selection page.
2. Results Column
This entry specifies the Results Column.
The risk calculation will result in the items in the spatial reference overlay receiving an attribute with their individual risk value.
A default name will be suggested for this attribute – based on the type of risk calculation and the date the command is run.
For example:

You can change this name. Simply ensure it follows SIS Desktop property naming conventions i.e. alphanumeric and underscore characters only.
The Results Column property is of type double, e.g. RoutecostRisk_2017_03_13#.
TIP: The # need not be entered into the Results Column box.
This property is added to the overlay’s schema.
If the schema already includes a property of this name, you will be warned about existing values that may be overwritten:

3. Create results as

Schema column and theme on selected overlay: The Geography units entry at the top of the dialog specifies the overlay on which the resultant risk map is to be based (e.g. super output areas.)
If the selected spatial reference overlay is not editable, only the New internal overlay (copy of selected overlay) option is made available.
4. Load Risk Model
Click Load Risk Model to load a previously saved risk model.
Click Next.
The next window in the wizard helps you set journey features like penalities, identifiers etc)
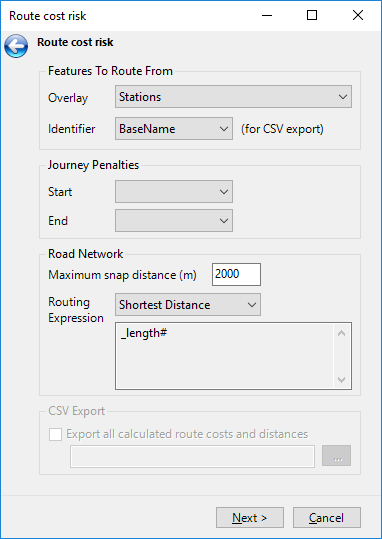
Features To Route From
The Overlay and Identifier you have selected in the previous window is displayed here.
Journey Penalties
If start/end penalties are required (for instance to allow for station reaction time), select them from the drop-down list.
- “Start” value shows the available schema columns from the “Geography Units” chosen at the beginning of the wizard, e.g. Stations.
- “End” value likewise, comes from the “Features To Route From” overlay, selected in the same dialog. Again, this drop-down shows the available schema columns in the overlay.
In both cases, the schema column selected should contain a numeric value, integers or doubles, which represents the “penalty” in minutes if using a Highways or ITN routing expression. If Shortest Distance is used, it represents a penalty in meters.
Road Network
Maximum snap distance (m): Specify the maximum snap distance, i.e. if an incident is further away from the network than this distance it will not be included.
Routing Expression
The Route Cost risk command requires a routing expression to be entered. To do this , select an expression typeone of the drop-down box options as follows:
Shortest Distance
ITN Road Speeds
Meridian 2
Own expression - enters a previously created expression
Paste into box below - paste or type an expression into the expression box.
CSV export
If a CSV export of all calculations is required ( ie from each FROM point to every TO point) then it is necessary to also select an identifier attribute for items on the overlay selected here.
(CSV export is only possible if an identifier for the geography units has also been selected in the first dialog of Route Cost).
Check the Export all calculated route costs and distances tickbox and tick the ... button to set a location for the exported .csv file.
Click Next.
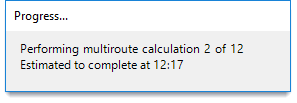
The risk values are now being calculated. This process may take some time; check the progress bar periodically.
When the values have been calculated the Specify theme style dialog will be displayed:
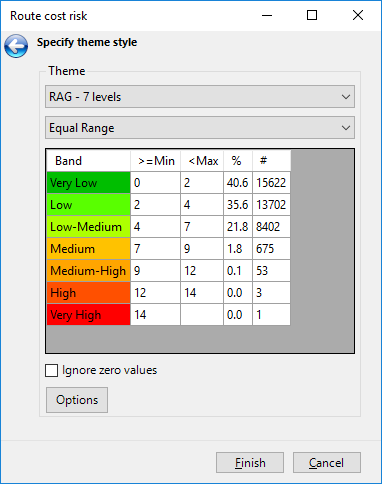
Use the drop-down menu to set the theme style.
There are two sets of Themes:
- RAG: Red Amber Green risk colours
- Heat – based on green to red hotspot colours.
TIP: Themes are defined in the Risk Modeller's configuration file: riskModellerConfig.xml.
Use the second drop-down to define how the bands are calculated for the current set of results (i.e. by Equal Range or Equal Count.)
The decision to use either of these options depends on the actual values.
The theme Band ranges can be manually adjusted by entering new values in the >=Min column.
Check the Ignore zero values tickbox if required.
Click Options to display the Theme Settings dialog:.png)
| Option | Description | |
|
Theme pen for geography units |
If required change the pen style by selecting a style from the Style drop-down box. |
|
|
When ignoring zero values |
Check the Set zero values blank in theme tickbox to prevent all zero values which could result in large areas of colour being shown in the output grid. |
|
|
Theme Labels |
Check the Label ranges with numeric limits tickbox to label the ranges with numeric values. |
|
Click OK and the Save Risk Model button to save the Risk Model.The model settings are saved as a .JSON file.
Click Finish to create Route cost-based risk data.