Configuring the TileServer
The TileServer provides tiles for background mapping. It also acts as the central server for GeoJSON files created by the Cover Modeller Service.
The TileServer should be accessible by both the Cover Modeller Service and Cover Modeller Client.
1.openmaptiles and osopenzoomstack folders contain data for the TileServer. Add these folders to the root TileServer folder. This data will be supplied by Cadcorp.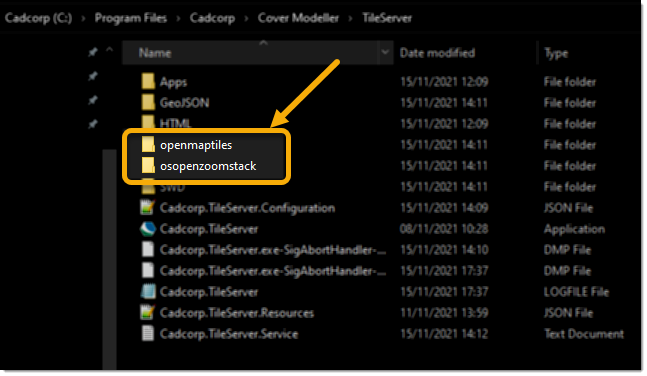
2. Create an SWD which will be used by the service for running analysis.
This SWD should contain:
-
Layer of area features (Coverages). These are themed to describe the level of coverage at this location. These can be irregular features such as Wards or regular grids for a uniform coverage.
-
Road Network – built using Network Manager for routing
-
Vehicle Layer (Vehicles) – this requires the data in a SQL Server spatial data layer, feed from a live GPS position. Each vehicle should include a call sign. Other attributes can be included if required.
The SWD and associated data should be stored in the SWD folder.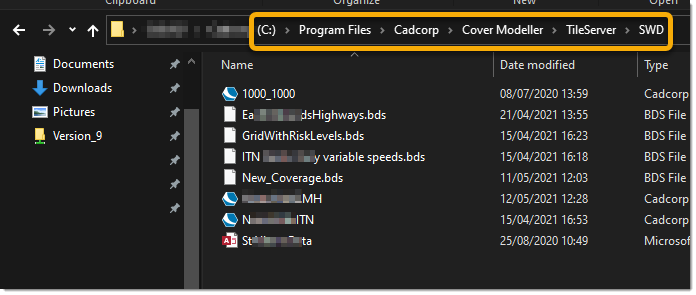
3. Add any custom data files
Custom data layers can be added to the client by be exporting layers to GeoJSON (using SIS Desktop) and then placing them in the \Apps\CoverModeller\live\data folder.
4. Display of Custom Overlays and styling of data in the Cover Modeller Client:
Customise your settings in \TileServer\Apps\CoverModeller\live\config.json
-
“center” – defines the starting view
-
“overlays” are additional layers of information. These are optional but add context. These layers need to be exported to GeoJSON (using SIS Desktop) and then placed in the \Apps\CoverModeller\live\data folder
-
“background_layers” are polygon datasets of customer data
-
“name” is the name that will be displayed in the client for this layer
-
“style” are the styling options
-
“url” is the path to the GeoJSON file in the \Apps\CoverModeller\live\data folder
-
-
"background_points" are point datasets of customer data.
-
“name” is the name that will be displayed in the client for this layer
-
“icon” are the styling options for a png image file used to display each point and included a “url” which is the relative location of the image file to be used.
-
“url” is the path to the GeoJSON file in the \Apps\CoverModeller\live\data folder
-
-
-
“coverage” - defines style for the different required overlays in the Cover Modeller Client
-
"name": "Risk Level" defines the style for features that have no risk value
-
-
"styleProperty": "risklevel" defines the style for features which have a risk level value the same as "match": [3,4,5,6,7,8,9]
-
"isochrones": {"name": "Travel Extent" defines styles for the isochrones.
-
"vehicles" defines the style of appliances depending on their status.
1. Remove the sample overlays (boundaries.json and stations.json) from the config.json file if you do not have appropriate GeoJSON files in the data folder.
2. You cannot comment text out in JSON so make a copy of the file for any illustration or reference purposes (e.g. adding layers to the client.)