Knowledge Types- Statistics
Local Knowledge - Statistics return the results of an expression based on the marker location or the map centre coordinates using the Local Knowledge template.
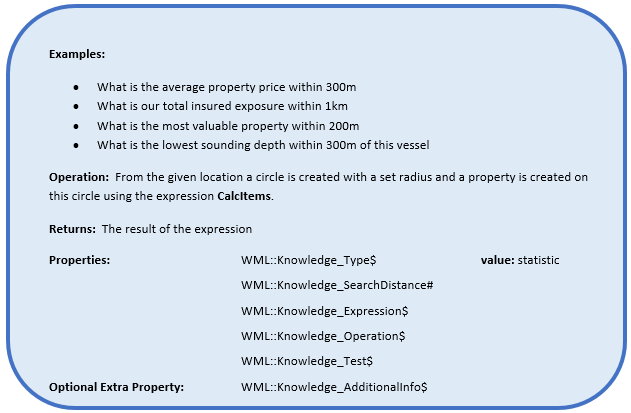
For any given location, Cadcorp SIS Notice Board 9 can return relevant statistics. The statistics are set to carry out an expression based on the marker location or the map centre coordinates and return a statistic to display in the Local Knowledge template.
The properties used are based on the CalCItems() expression used in Cadcorp SIS desktop.
CalcItems(Overlay(«name», {«filter»}), «expressionorproperty», «operation», «spatialtest», «geometrytype», «geometry»)
You can see from this expression where some of the required properties are derived from:
| Expression | Description |
|
Overlay(«name», {«filter»} |
This is defined by the layer which the other properties are added to. |
|
«expressionorproperty» |
WML::Knowledge_Expression$ Sets the correct Column to run the expression on |
|
«operation» |
WML::Knowledge_Operation$ Sets the mathematical operation to be carried out. |
|
«spatialtest» |
WML::Knowledge_Test$ Defines the spatial relationship between the data and the search area. |
|
«geometrytype», «geometry» |
ST_Geometry This will be set to ST_Geometry by default so the expression will use the ‘current’ geometry (the geometry created when the search distance is defined) to perform its calculations. |
See the example below to set up a statistical search for the most common number (mode) of residents per property within 250m.
Setting the Property Values
First define the overlay to be used in the statistic query and set the search distance for the query to be run within.
In your Local Knowledge SWD, right click on the overlay you wish to add the property to and select Properties:
Then select Properties again in the Overlays dialog:
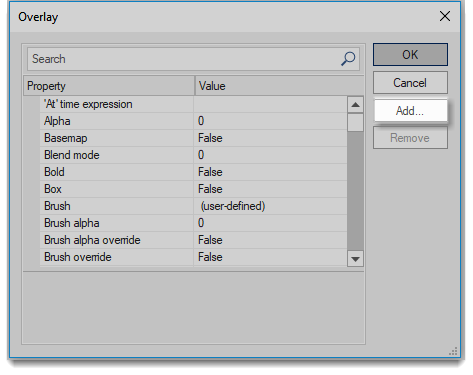
And finally select Add… to add a new attribute:
Add this property to the layers you want to query for statistics.
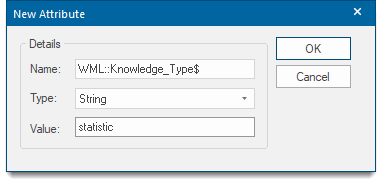
Select Add.
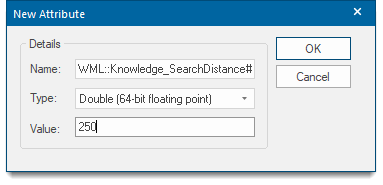
In the New Attribute dialog, type WML::Knowledge_SearchDistance# into the Name field.
Type a number (e.g 250) in the Value field.
Click OK.
Building the Expression
Select Add again.
In the New Attribute dialog, type WML::Knowledge_Expression$ into the Name field. This property identifies the overlay column on which the expression will be executed:
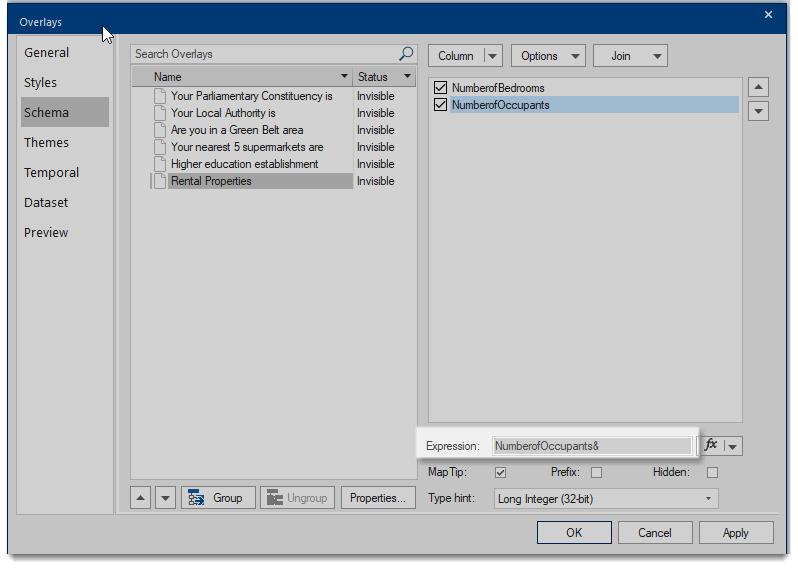
Type NumberofOccupants& into the Value field.
Click OK.

Note: You must use the Expression rather than the Column Name so in the example below you would need to use NumberofOccupants& and not NumberofOccupants.
Now you will set the mathematical operation on the data (NumberofOccupants) that fall within the 250m search distance. Available operations are:
Operation
This sets the mathematical operation to be carried out on the data (NumberofOccupants) that falls within the 250m search distance.
- OP_Count - The number of results.
- OP_Sum - The sum of the results.
- OP_Min - The minimum result value.
- OP_Mean - The average of the results.
- OP_Median - The middle number in the list of results.
- OP_Mode - The number which appears most often in the results.
- OP_Max - The maximum result value.
- OP_Stddev - (Standard Deviation) a measure of the spread of the results.
- OP_Variance - The average of the squared differences from the Mean value.
- OP_Skewness - Reduces any positive or negative skewing of the results.
In this example you are looking for the most common number of residents so you will use the OP_Mode.
Select Add.
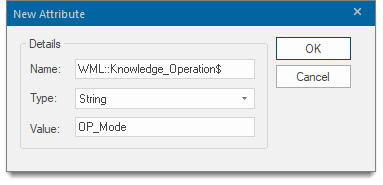
In the New Attribute dialog, type WML::Knowledge_Operation$ into the Name field
Type OP_Mode into the Value field.
Click OK.
Spatial Test
Next you will set the spatial test between the data (NumberofOccupants) and the 250m search distance.
This defines the spatial relationship between the data and the search area for the resultant statistic.
In this example the value is ST_Intersect so the expression will work out the Mode (most common value) of the dataset which intersects with the search area. Available spatial tests are:
- ST_Contains - Does the data intersect with the search area?
- ST_Crosses - Does data cross the search area?
- ST_Disjoint – Is the data disjointed from the search area, do they not intersect in any way?
- ST_Equals - Is the data equal to the search area?
- ST_Intersect - Does the data intersect the search area?
- ST_Overlap - Does the data overlap the search area?
- ST_Touches - Does the data touch the search area?
- ST_Within - Is the data within the search area?

The values set will create the following expression which will return a statistical value:
CalcItems("Rental Properties"),{NumberofOccupants&},OP_Mode,ST_Intersect,ST_Geometry)
The Cadcorp Notice Board web page will display: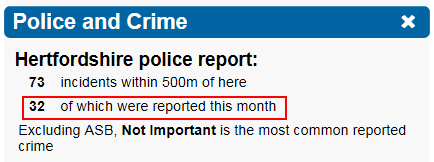
HTML Template
The template used to display the results of the Local Knowledge statistic query has the following structure:
<div>Text to describe the result {Statistical Result}</div><br>
So for the example described above to be displayed on the WebMap site, the following template needs to be present in the Templates table of the config.db:
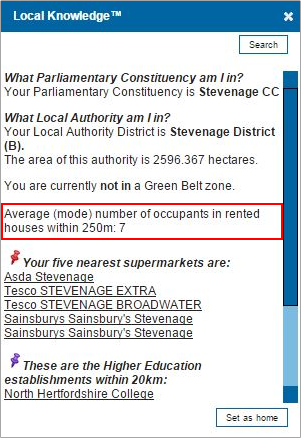
<div>Average (mode) number of occupants in rented houses within 250m: {Items[0].Attributes[CalcItem]}</div><br>
This will result in the following output on your Cadcorp SIS Notice Board 9 site:
Whilst the above result is valid, it might need an extra filter:
Additional Info Parameter
To give extra context to the result that is returned from the Local Knowledge statistic query, use the WML::Knowledge_AdditionalInfo$ property.
EXAMPLE:
Local Knowledge Statistic Question: What is the most common number of residents in each property within 250m?
Answer Returned: 4
Currently there is no context to this result, the user doesn’t know if this is a good or a bad result or how it relates to their investigation.
Consider for example if the user carries out a survey on people living alone in rented property, this value could give a preliminary indication of whether it is worth visiting the area to carry out research.
If the result is greater than or equal to two, it is less likely there are many single occupancy households in the area.
This result can be queried using an iif statement. An iif statement determines if an expression is true or false, if it is true it returns one value, if it is false it will return another value:
Iif(LocalKnowledgeExpression) statement,
“returned value if true”,“returned value if false”)
So using the example above, if the result of the expression shows the most common number of people in a household is greater than or equal than two, it is less likely that there are many single occupancy households in that area.
To return this information to the user you would use the following iif statement:
Iif(CalcItems("Rental Properties",{NumberofOccupants&},OP_Mode,ST_Intersect,ST_Geometry)>= 2,
"Low probability of single occupancy households","High probability of single occupancy households")
This lif statement is used as the value for the property:

HTML Template
If using the Additional Information Property an addition also needs to be made to the template so that the result is displayed on the site.
Structure of original template:
<div>Text to describe the result {Statistical Result}</div><br>
Structure with additional information:
<div>Text to describe the result {Statistical Result}<br />{Additional Information}</div><br>
Actual HTML code required for the example used in documentation:
<div>Average (mode) number of occupants in rented houses within 250m:
{Items[0].Attributes[CalcItem]}<br />{Items[0].Attributes[AdditionalInfo]} </div></br>


