Properties of SWD
Properties displays and allows editing of the properties of the SIS Workspace Definition.
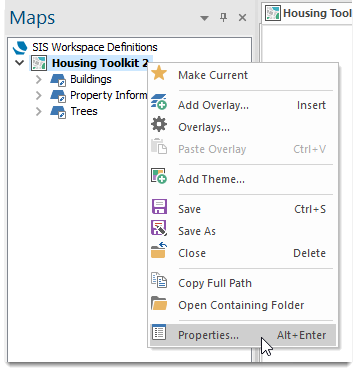
In the map window, right-click on the SWD to open the context menu and select Properties.

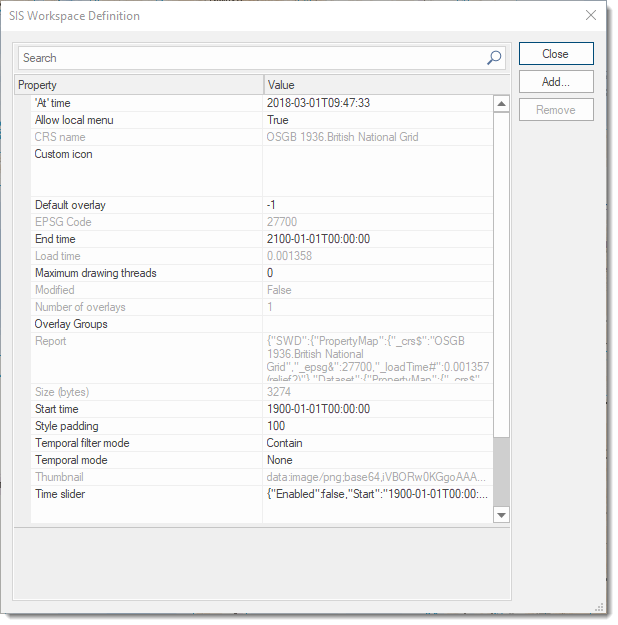
This opens the Properties window. To edit a field, simply click inside the Value field.

|
Property |
Value |
|
|
‘At Time’ |
Date and time the SWD was created. |
|
|
Allow local menu |
Allows Map Window local menus to be used. Defaults to True; can be set to False in the drop-down menu at the right-hand end of the row. |
|
|
CRS name |
The matching CRS object name, or default description. |
|
|
Custom Icon |
A custom icon can be defined for the SWD for display in, for example, the Map control bar. |
|
|
Default Overlay |
The currently active Overlay number(starting at 0). |
|
|
EPSG Code |
The matching EPSG code, if any. |
|
|
End time |
An end time for the SWD can be defined, used in Temporal Analysis. |
|
|
Load Time |
The total time to load the SWD into the current session. This can also be seen in File - Report. |
|
|
Maximum Drawing Threads |
Database connectivity can now be optionally optimised by using this property. The default value of 0 allows SIS Desktop to decide heuristically how to split Overlays between 'threads'; a value of 1 or greater will force SIS Desktop to use that number of 'threads' (with 1 meaning draw in a single 'thread'). |
|
|
Modified |
Will show as False if SWD has not been modified since opening. Will show as True if SWD has been modified since opening. |
|
|
Number of overlays |
Number of overlays in SWD. |
|
|
Overlay Groups |
Names and details of any overlay groups, i.e. {"OverlayGroups":[{"Name":"My Overlay Group","Start":0,"End":2},{"Name":"My New Overlay Group","Start":3,"End":5}]} "Name": Name of overlay group. "Start": First overlay in group. "End": Last overlay in group. "Name":/"Start":/"End": are repeated for each overlay group. |
|
|
Report |
JSON report of the SWD that includes this information:
This property is automatically populated with default JSON which can be used as a template. |
|
|
Size (bytes) |
Size of the SWD in bytes. |
|
|
Start time |
A start time for the SWD can be defined; this will be used in Temporal Analysis. |
|
|
Style padding |
The Style padding value is used with the larger of the width and height of the drawing extents to pad the extents, e.g. to ensure Point Items that are outside the drawing extents (but whose Symbol overlaps the drawing extents) are drawn correctly. The Style padding value is interpreted as 1/10ths of a percent, e.g. 100 means 10%, the maximum value is 1000 which equates to 100% and translates to three times the maximum of the width and height of the view extents. |
|
|
Temporal Filter Mode |
When using temporal analysis, the data in the SWD can be automatically filtered using one of the possible modes selected from the dropdown. |
|
|
Temporal Mode |
Defines if the data in the SWD can be used in temporal analysis
|
|
|
Thumbnail |
The thumbnail image of the data used by the SWD, stored in Base64 encoding. |
|
|
Time Slider |
Enables the scaling of the temporal analysis slider bar. The following can be defined using JSON:
This property is automatically populated with default JSON, which can be used as a template. |
|
|
background Colour |
Background colour for the SWD specified in RGB Color Model e.g rgb(164,164,164) |
|
|
Projection |
Displays preset SWD projection |
|
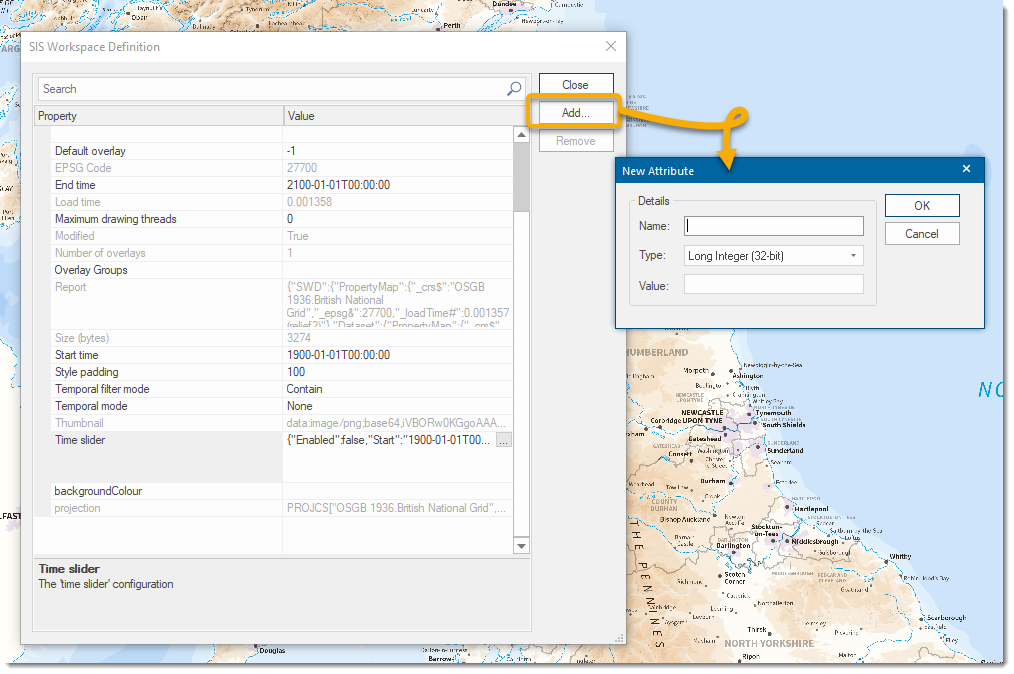
To add a new attribute to the SWD click the Add... button to display the New Attribute dialog:
