Report
Report displays detailed information on SWD load times.
This option helps you analyse overlay load times and can help you identify any "slow" loading overlays.
Select File > Info > Report.
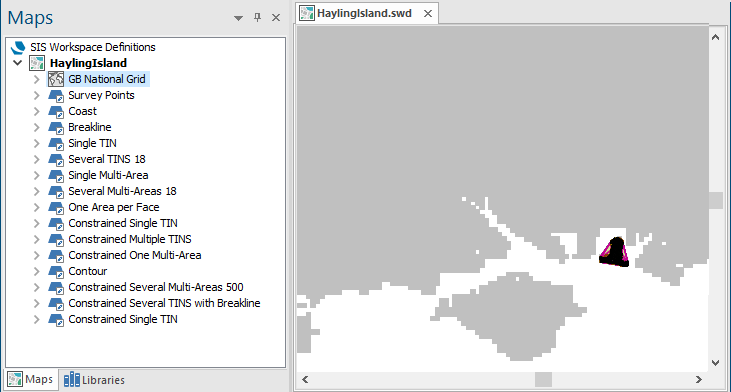
In this example, load an SWD, HaylingIsland SWD:
Select Report.
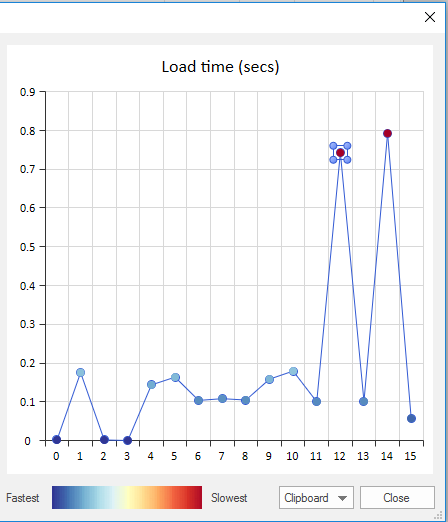
The SWD load time (secs): dialog will be displayed:
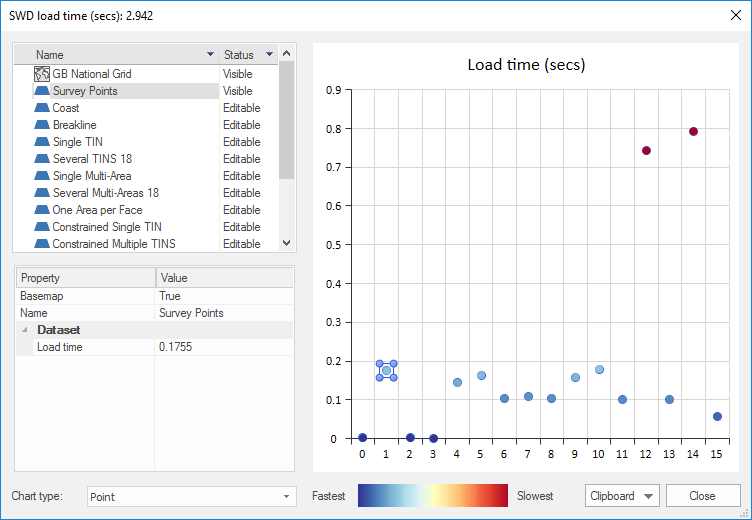
The chart will show the elapsed time to load each overlay within the SWD.
As you select each overlay in the left-hand pane the point for that overlay will be highlighted.
For example Contour overlay shows an Load time of 0.7424 secs:
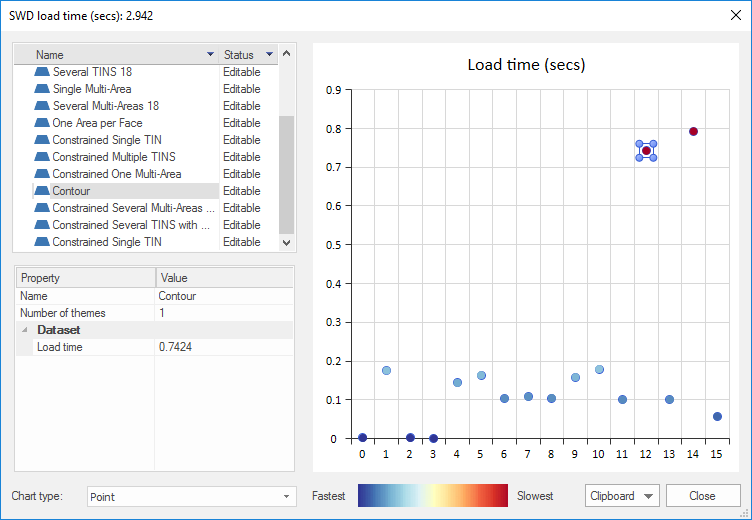
Properties and their values are also shown for each overlay in the loaded SWD, as follows:
The Chart type drop-down allows you to select how you wish the chart to be displayed.:
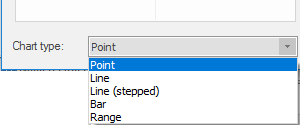
The options are:
Point (shown above)
Line:
Line (stepped):
 chart example.png)
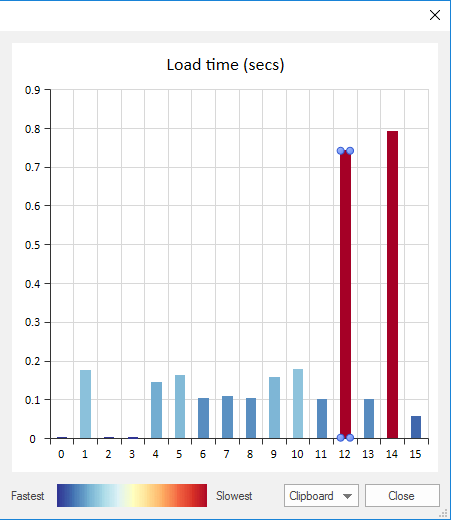
Bar:
Range:
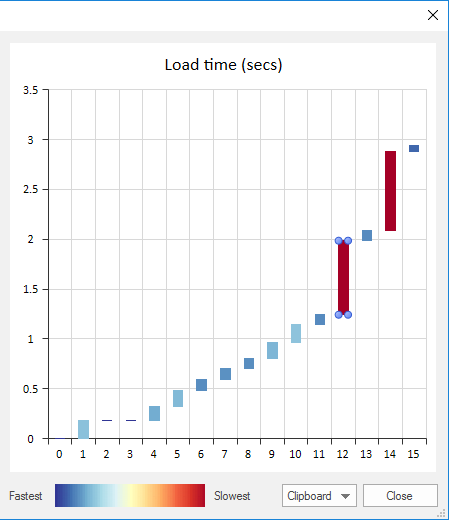
Clicking on a point, or bar in the above chart types will highlight the corresponding overlay in the left-hand Name/Status pane.
The Fastest/Slow colour band indicates which overlays were relatively fast or slow:
In each of the above charts the overlays shown in dark blue are the fastest to load and the overlays shown in red are the slowest.
The Clipboard drop-down allows you to copy the chart or the data.
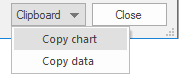
The Copy chart option allows the displayed chart to be copied. The chart can then be pasted into an editing or processing application (for example PhotoShop or Microsoft Word).
The Copy data option allows the SWD data to be copied and pasted into a JSON editor for further analysis.