Bivariate
The Bivariate theme applies style settings by matching the result of two expressions against a lookup table of values. These can be individual values or ranges.
Click Home > Add Theme > Style and select Bivariate.
Click Next to set X and Y axis expressions.
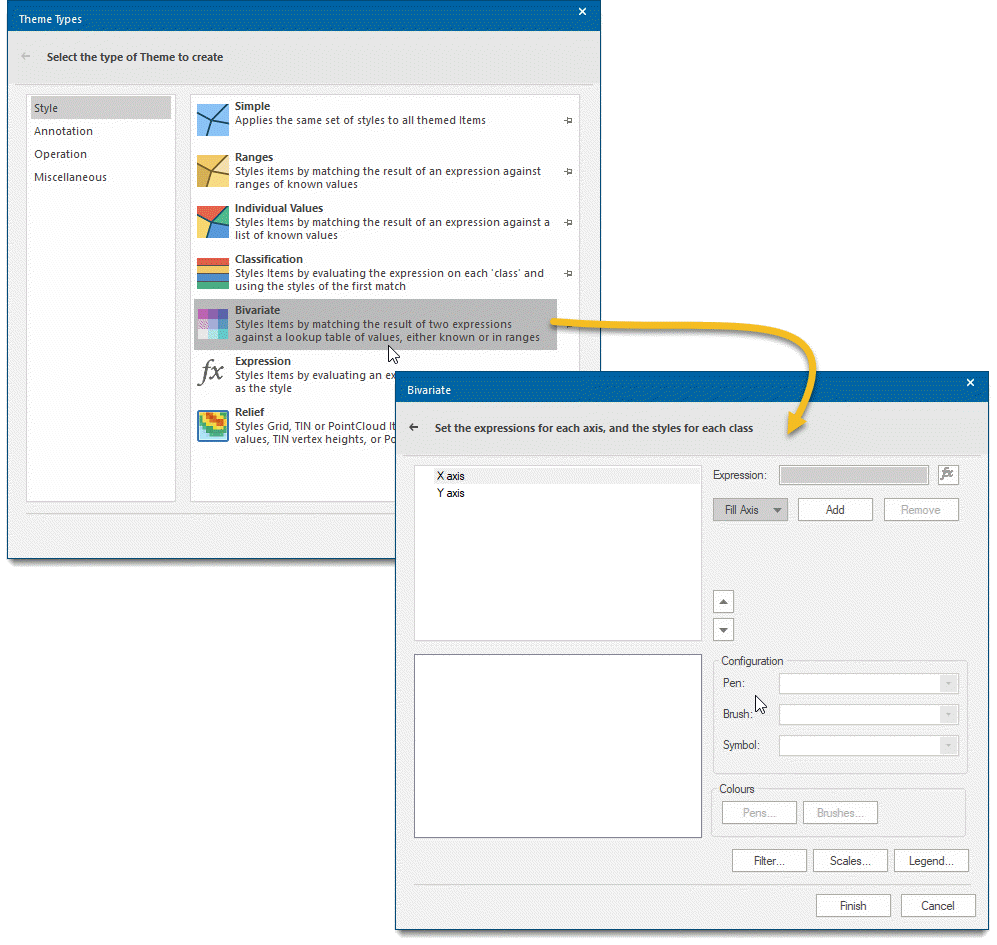
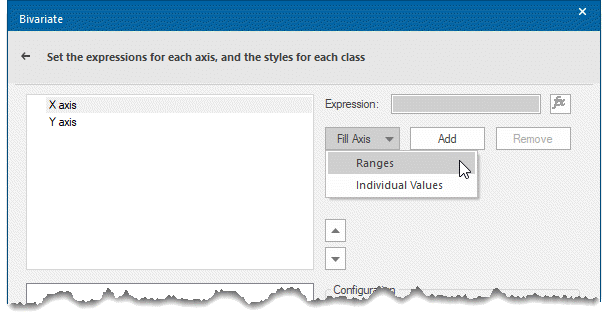
- Select the X axis in the top left panel
- Select the Fill Axis button and choose either Ranges or Individual Values from the dropdown list.
-
Note: Numeric data needs to be split in to ranges such as 1 to 100, 100 to 200 etc while nominal data such as crime types are better served as individual values.
-
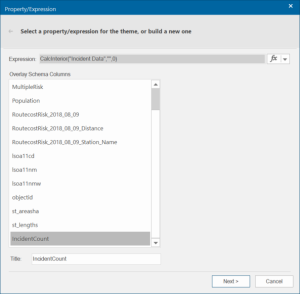
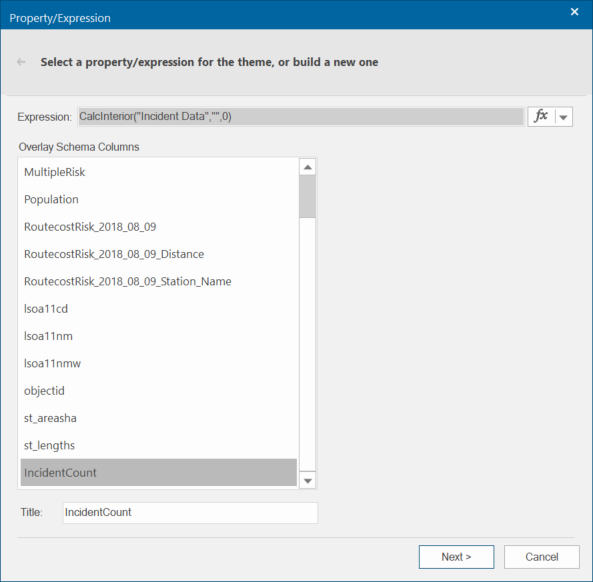
The Property/Expression dialog opens. Select a property to be used for the range (IncidentCount in this example)
-
The Property/Expression dialog opens. Select a property to be used for the range (IncidentCount in this example) and click Next.
-
You are taken to the Ranges dialog.
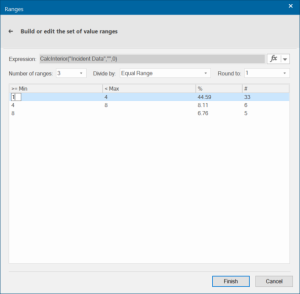
- Use these options to customise your data ranges.
-
You can set the Number of Ranges, choose a division method and even roundoff the data to the nearest unit of 10, 100, 1000 and so on.
-
Click Finish.

-
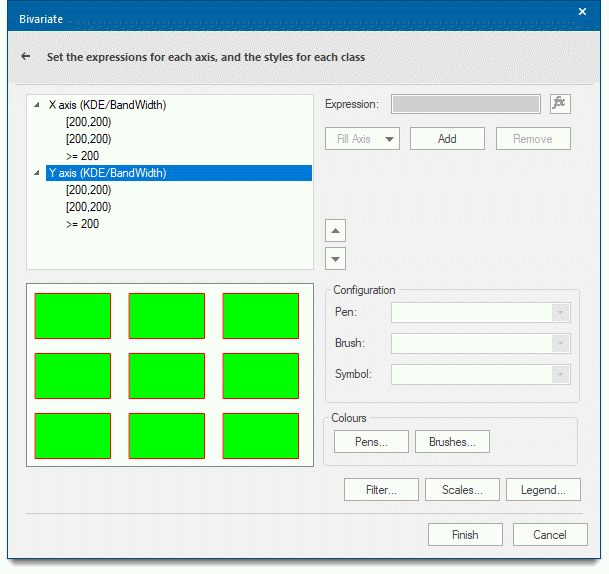
Select the Y axis in the top left panel
- Select the Fill Axis button and choose either Ranges or Individual Values from the dropdown list.
- Follow steps as above and click Finish.
-
You can individually select pen and brush colours in the Configuration group.,
-
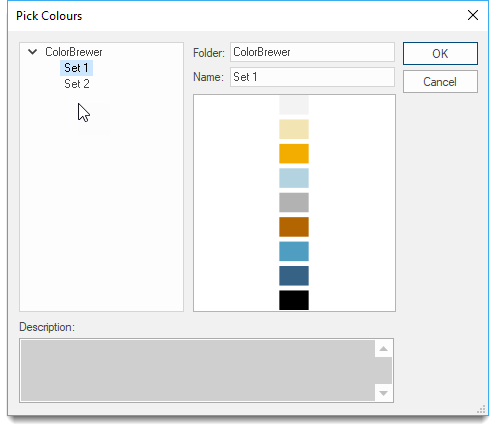
Else simply choose pre-defined colour sets from the Colours group.

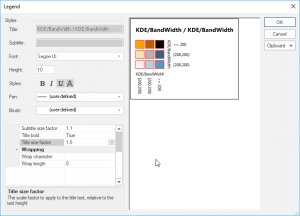
- Click the Legend button to open the options.
- Here you can customize the appearance of your legend including font sizes, colours and more.
- Click OK when you are done.
- Click Finish on the Bivariate dialog.

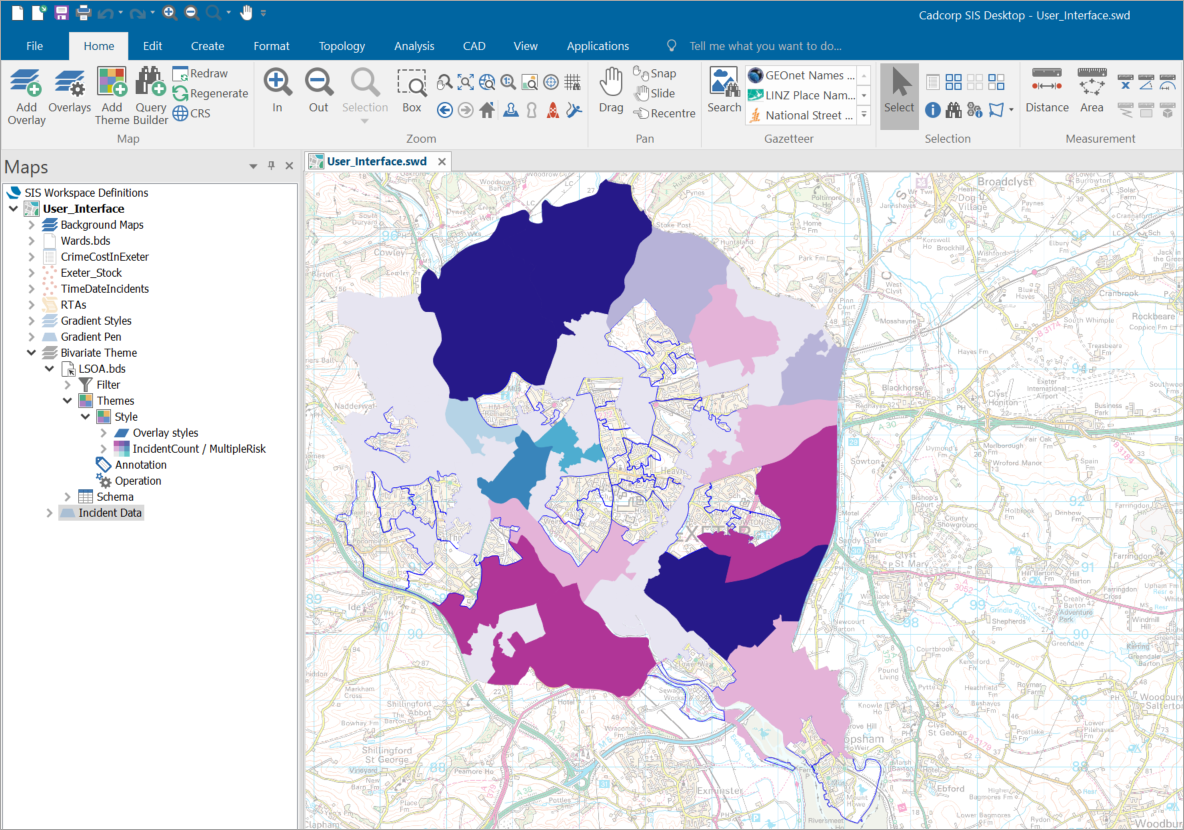
Here is an example of an applied Bivariate theme.