CPU
The CPU report displays the percentage of processor resources used over a time period.
To see this chart, select Dashboard > CPU.
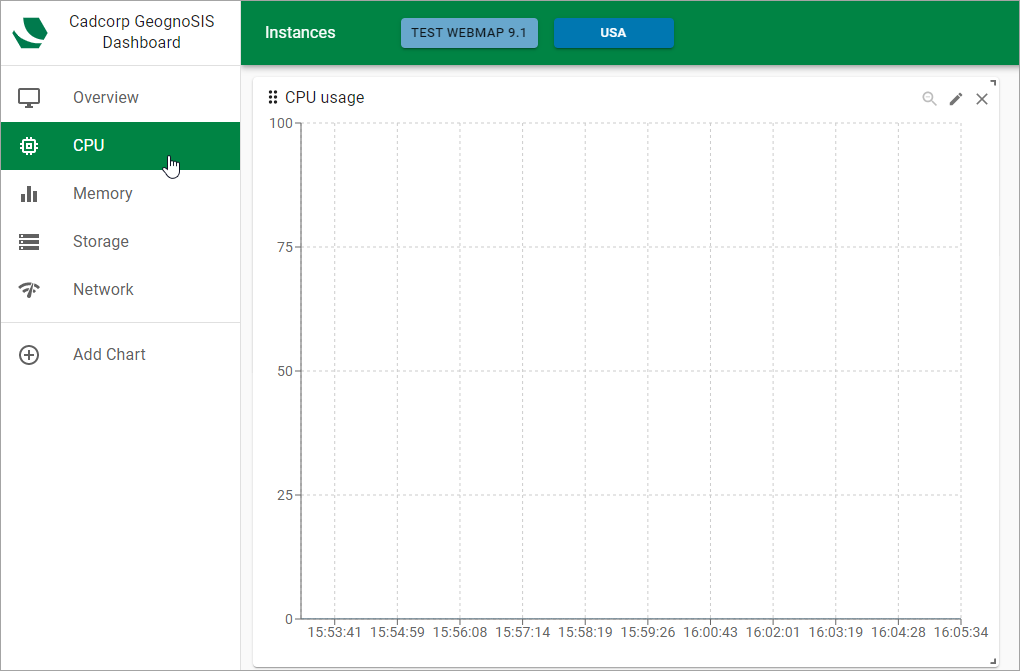
In Area and Area stacked graphs, the x-axis plots time at 5 second intervals. The y-axis plots percent (%) of CPU resources. Pie chart graphs, radial graphs and tree graphs do not indicate peaks or averages.
To be confirmed
Drag your cursor over an area of interest to zoom. Click Reset Zoom  to return to normal view.
Click  to customise the chart including changing the title, type of chart, instance etc.