Memory
The Memory report helps you track the amount of memory used by GeognoSIS.
To see this chart, select Dashboard > Memory.
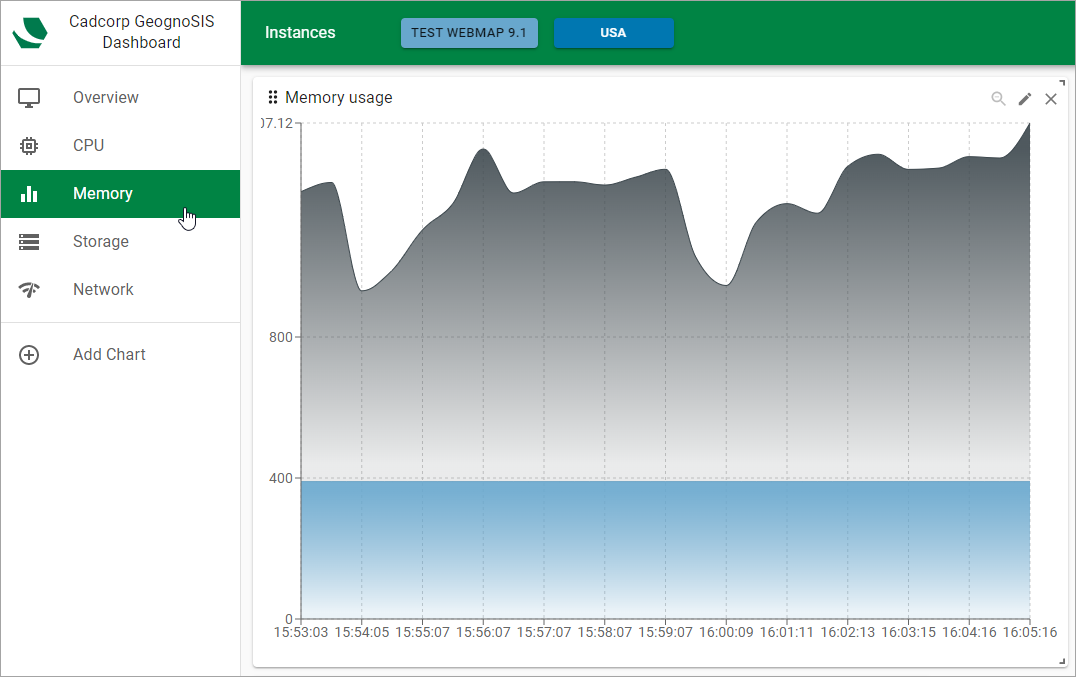
In Area and Area stacked graphs, the x-axis plots time at 30 second intervals. The y-axis plots memory in MB. (TO BE CONFIRMED) Pie chart graphs, radial graphs and tree graphs do not indicate peaks or averages. It simply displays a breakdown of the memory usage. Hover over different sections of the pie chart to display more information. Select a section to expand it and to hide the rest of the sections.
Each concentric circle of the radial graph represents an individual GeognoSIS instance.