Point Settings
After setting up polygon display, you can customise the style of the points used on the map.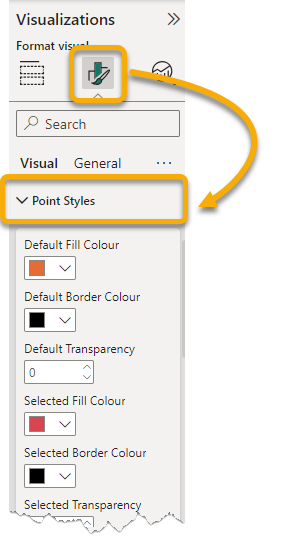
Use the colour palettes to set default fill colours and border colours.
For colour options, select the dropdown next to the colour box and choose from a set of Theme colours, recently used colour or use a colour picker via the “More Colors…” option:
| Field | Description |
| Default Fill Colour | Fill colour of the displayed points in the visual when being viewed. |
| Default Border Colour | Border colour of the displayed points in the visual when being viewed. |
| Default Transparency | Transparency level of the polygons where 100 is fully transparent. |
| Selected Fill Colour | Fill colour of a selected point. |
| Selected Border Colour | Border colour of a selected point. |
| Selected Transparency | Transparency level of the point when selected where 100 is fully transparent. |
| Hover Fill Colour | Fill colour of the displayed point when hovered over. |
| Hover Border Colour | Border colour of the displayed point when hovered over. |
| Hover Transparency | Transparency level of the displayed points in the visual when hovered over. |
| Radius | Edit the radius of the points for ease of viewing. |
| Dynamic Radius Min | Dynamic data can improve the visual. Larger values can be represented with larger points for an attribute. This sets the minimum radius used on a dynamic dataset. |
| Dynamic Radius Max | Sets the maximum radius used on a dynamic dataset. |
| Number of Shades | Sets the number of different shades of a colour assigned to point in a dynamic colour dataset. You can set up to 20 different shades. |
| Colour Spectrum | Sets the range of different colours that can be used to display point data in a dynamic colour dataset. A higher number gives a larger deviation from the default fill colour set. Maximum colours available is 100. |