Select Extent of Current View in the Select the spatial content for this book of plots dialog and click Next to display the following Book Plotter - Filter overlays dialog:
Select either:
Click Next.
The Set the format and layout of the plots dialog will be displayed:
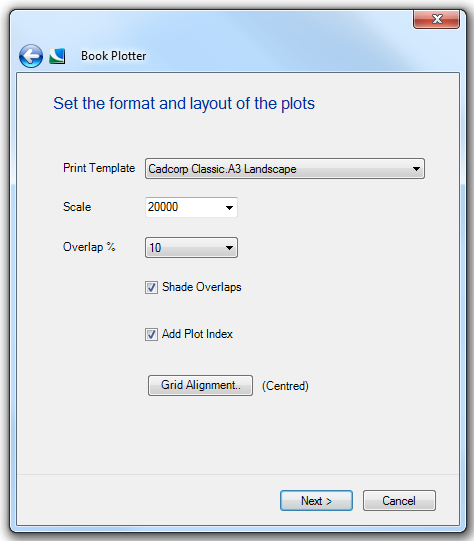
Print Template - The drop-down box allows you to chose the format of the output pages.
Scale - Select the scale at which you want the map to be displayed in each page. You can select from the choices in the drop-down list or type any intermediate scale.
Overlap % - It might be useful if the map on each page of the book overlaps the adjacent page to aid legibility. This is typically by 5 or 10%.
Shade Overlaps - In some map books, road atlases for example, the overlapping part of each page is shaded a slightly darker colour to indicate that this part of the map is also visible on the adjoining page. Check this tickbox if you want the overlap to be shaded.
The overlap shading can be adjusted from the Overlap styles button on the Print Template Tools dialog.
Add Plot Index - Check this tickbox to add a Plot Index to each page to indicate the position of the current page on the grid. A Plot Index grid will also be created as a new overlay in your Map Window which can be used to create an index page and feature gazetteer.
Grid Alignment - Press the Grid Alignment button to display the Grid Alignment dialog to allow you to specify how the Book Plotter grid is to be aligned:
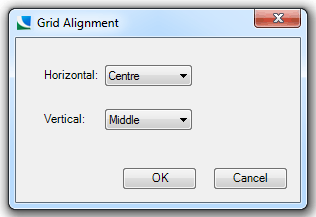
When Book Plotter decides how to fill each page, it looks at the size and proportions (aspect ratio) of the chosen print template. It is unlikely that your chosen area exactly fits a matrix of templates, so there will inevitably be a 'margin' of map outside of the area. You can decide whether this extra mapping is evenly distributed around the 'outer' pages, or the pages are biased to the left or right, top or bottom:
The default values are Centered horizontally and Middle vertically.
When the grid alignment requirements are set click OK.
The Select the output type(s) dialog will be displayed:
Any number of the above options may be selected:
Save as SWDs - If you chose to save the output as SWDs, browse to the folder where you want to store these files. You are able to make a new folder if required. If you are running Windows 7, or later, you will also have the option to create a new folder if required. After setting the destination folder, click OK.
Save as PDF - Similarly, if you chose to save the output as PDF files, you will be prompted to select the destination folder. For PDF documents you can choose the resolution of the exported document in DPI (Dots per inch) in the range 15 to 1200 (the smaller the number the smaller the file size shall be).
Further PDF options available are:
Merge plots into a single PDF - This option produces a single PDF for the grid with all plots being drawn on one PDF document rather than creating an individual document for every plot.
Make overlays as separate layers in PDF - This option allows users of Adobe Reader 6 and above to turn layers on and off.
Save as JPEG - JPEGs can be produced by specifying a destination folder as well as the width and height in pixels that the resultant images shall be. The smaller the number you enter the smaller the file size will be however the resolution of the resultant image will not be as good.
Each JPEG file has an associated JGW file (ASCII file containing information for geocoding image data).
On completion click Next.
The Make the Book Plots dialog will be displayed. There are two variants of this dialog, if a Map Title has been defined in the print template then the following Make the Book Plots dialog will be displayed:
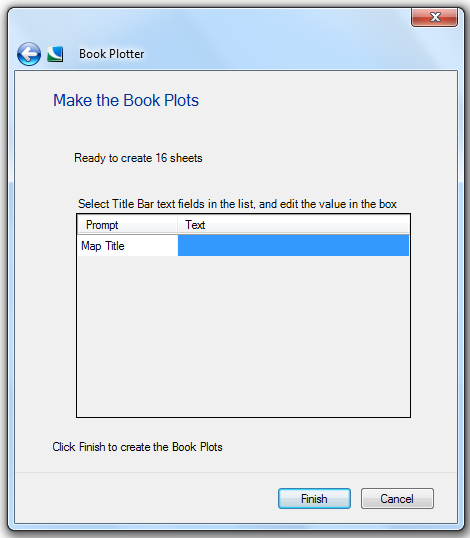
Enter the required title in the blue area of the Make the Book Plots dialog, this will append to the main title already defined in the print template.
If no Map Title has been defined in the print template then the Make the Book Plots dialog without the centre pane will be displayed:
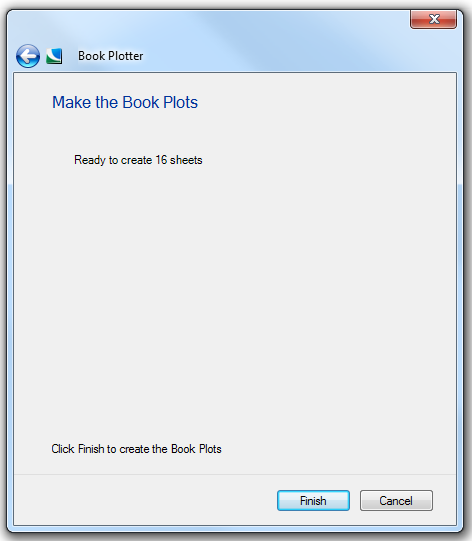
In either case if the number of sheets to be created seems incorrect, simply press the Back arrow at the top of the Make the Book Plots dialog and change your settings. The most likely reason to cancel the plot is because you selected an inappropriate scale for the chosen template, or you accidentally chose the wrong template.
When you are satisfied the number of sheets is correct click Finish to start the plotting process.
If you checked the Add Plot Index tickbox on the Set the format and layout of the plots you will first see this index being created on your map view. You will then see each page being created in turn.
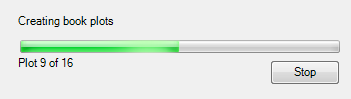
A green bar displayed on the Make the Book Plots dialog shows the progress of the plotting process.
Do not be concerned if each page preview does not appear to be updating the page number or the plot index. This is because the process is too quick for the display to be updated. The saved files or prints will display the correct page numbers.
You can press Stop at anytime during the plot creation process to stop the process at the point it has reached.
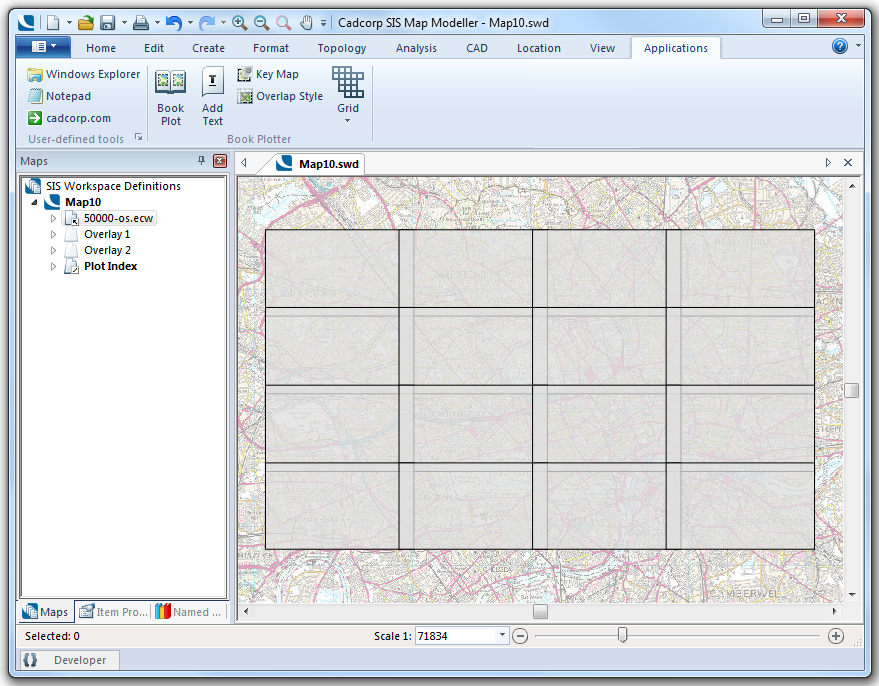
The following is an example of the display on plot completion:
Send comments on this topic.
Click to return to www.cadcorp.com
© Copyright 2000-2017 Computer Aided Development Corporation Limited (Cadcorp).