 button (100).gif) Statistics Statistics
Statistics Statistics
Statistics displays statistics on the current table column. To use this command you must go to Table View and select a column which has a numeric value.
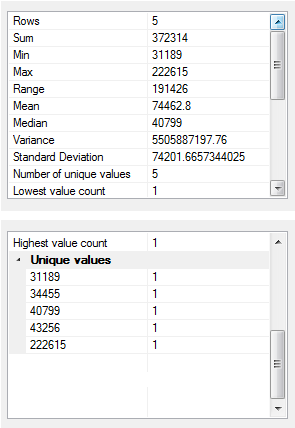
Depending on the data the following statistics will be shown in the Table Column Statistics dialog:
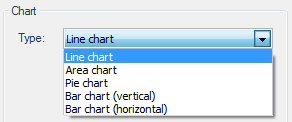
Also depending on the data the following chart types will be available:
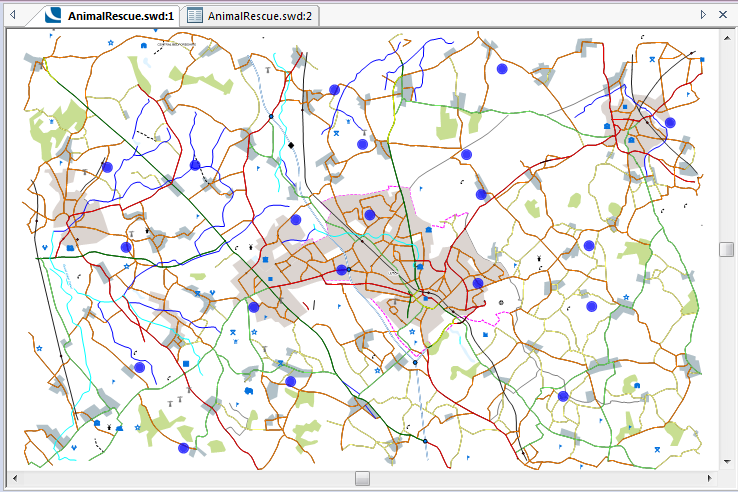
This AnimalRescue.swd example shows the locations and dates of animal rescue incidents, rehoming requests and a dangerous dog report:
Click Table [View-Document Views], the Table View will be shown:
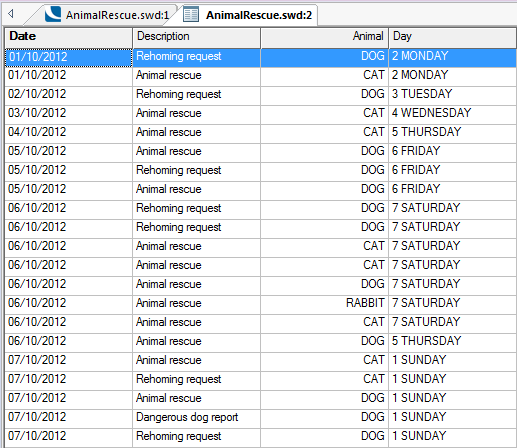
The columns are Date, Description, Animal and Day.
Select the Date column in the Table View and click the Statistics button.
A message will be displayed asking if you want to search the whole table for existing values.
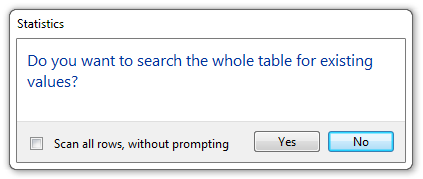
If you do not wish to see this message again during the current SIS session check the Scan all rows, without prompting tickbox.
Click Yes to continue, No will stop the command at this point.
The Table Column Statistics dialog will be displayed:
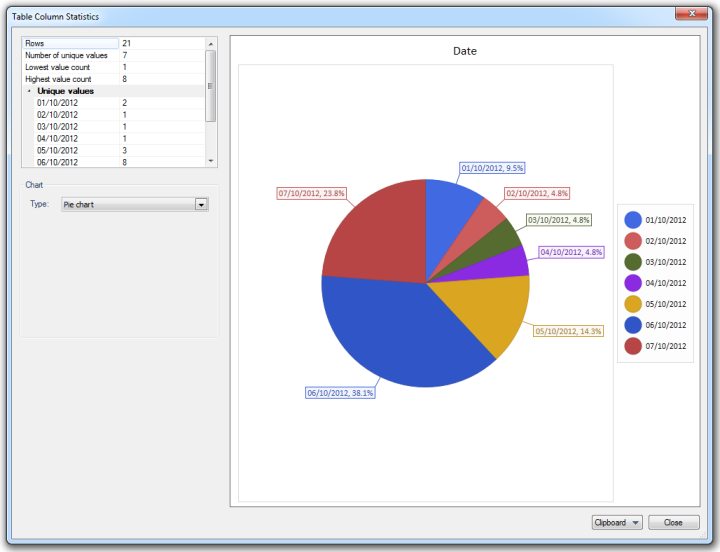
The display will open at the Pie chart setting, this can be changed in the Type drop-down box so that the data is shown as a Line chart, Area chart, Pie chart, Bar chart (vertical) or Bar chart (horizontal).
The Clipboard button drop-down gives the following options:
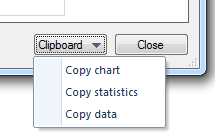
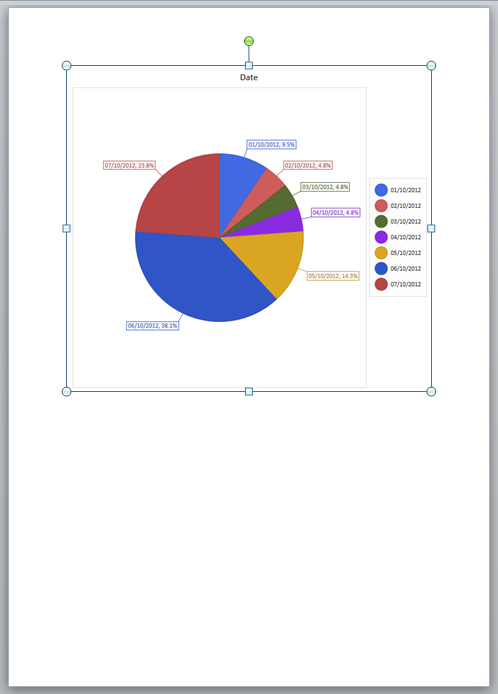
Copy chart - Copies the chart as displayed in the Table Column Statistics dialog to the clipboard. This can then be pasted into an image editor or pasted into an editing application, i.e. Microsoft Word:
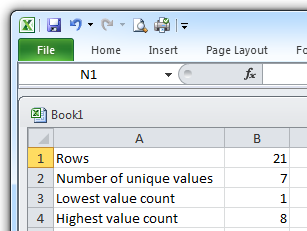
Copy Statistics - Copies the statistics as shown in the Table Column Statistics dialog, top left pane, to the clipboard. In this example; Rows, Number of unique values, Lowest value count, Highest value count. These statistics can then be pasted into a spreadsheet application, i.e. Microsoft Excel:
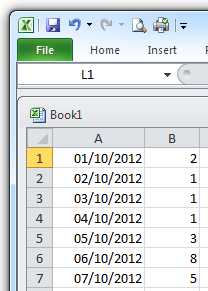
Copy data - Copies the data as shown in the Table Column Statistics dialog, top left pane, to the clipboard. The data shown depends on the table column selected when the Statistics command was started, in this example it is the range of dates. This data can then be pasted into a spreadsheet application, i.e. Microsoft Excel:
Top of page
Click to return to www.cadcorp.com
© Copyright 2000-2017 Computer Aided Development Corporation Limited (Cadcorp).