Knowledge Types
Introduction
There are four knowledge types that can be returned by Web Map Layers 8.0:
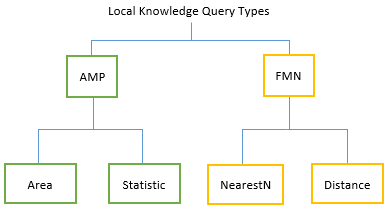
- Area – identifies if the given coordinates are within certain defined boundaries, if so it displays attribution accordingly.
- NearestN – finds the closest n items and places interactive markers on the map at their location to display feature information.
- Distance – finds all occurrences of a certain item within a radius and places interactive markers on the map at their location to display feature information.
- Statistic – This uses an expression to return a statistics about the data within a set distance.
Within your local knowledge SWD you will need to add specific properties, see the Creating an Overlay Property topic, to the overlay, these will then define the type of query to be run.
The tree diagram below illustrates which Local Knowledge Query Types belong to which categories:
Operation 1: Local Knowledge Area
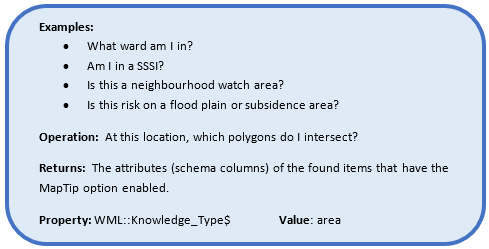
There are two types of local area knowledge queries that can be carried out:
- On a continuous dataset such as a postcode map where you are certain to always get a response.
- On discrete data for example if you want to know whether the current location is either ‘in’ or ‘out’ of a defined area feature.
Adding a property
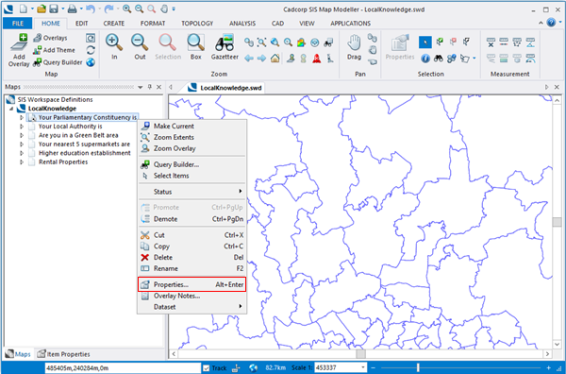
In your Local Knowledge SWD, right click on the overlay you wish to add the property to and select Properties:
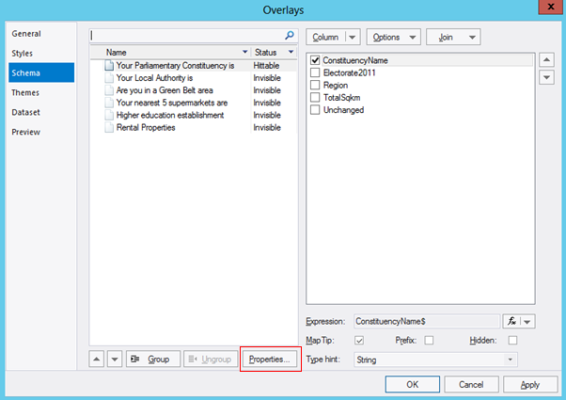
Then select Properties again in the Overlays dialog:
And finally, select Add… to add a new property:
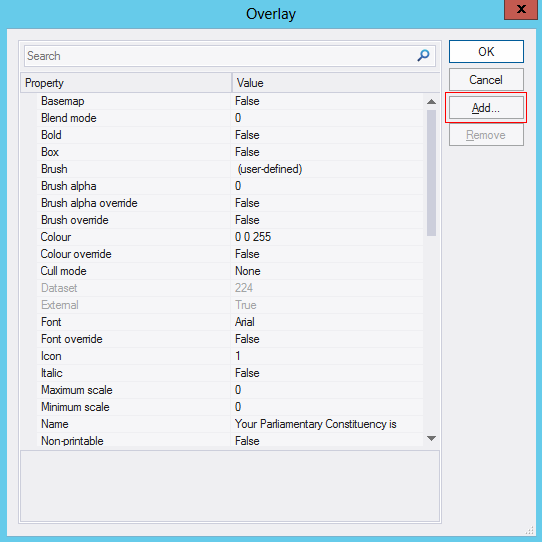
On layers you want to run the area query on, add the following property

Tick on the Map Tip option for any of the attributes within the schema that you want to see within the results.
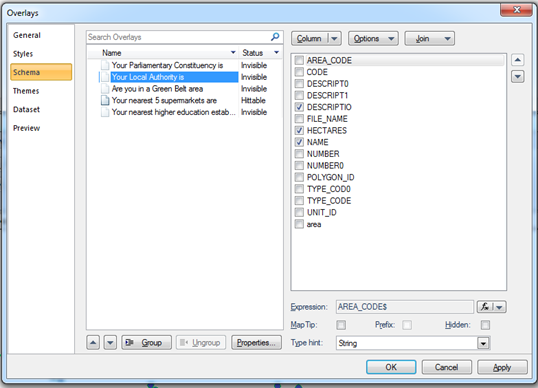
In the example above, only the attributes DESCRIPTIO, HECTARES and NAME will be returned.
Creating a Template for an Area Search
Templates are different depending on the search type and are defined in the webMapLayersConfig.db using HTML. To create a template, open the database in your SQLite database manager, navigate to the Templates table and add a new record with a name that corresponds to the overlay name in the SWD.
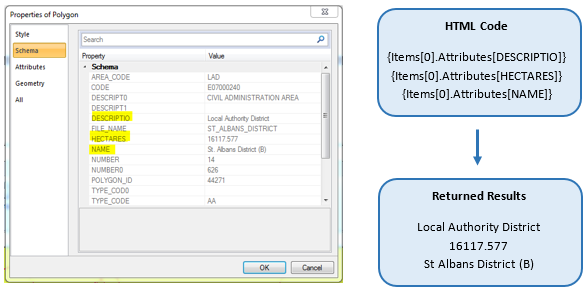
The information returned is defined by the HTML, in the schema above MapTips were ticked for DESCRIPTIO, HECTARES and NAME. These can be referenced using the following notations:
- {Items[0].Attributes[DESCRIPTIO]}
- {Items[0].Attributes[HECTARES]}
- {Items[0].Attributes[NAME]}
For example if the coordinates used in the local knowledge search falls within the polygon with the attributes shown in the Schema table, it would result in the following returned results:
Discrete dataset worked example: Am I in a green belt zone?
If you want to know whether the current location is either ‘in’ or ‘out’ of a defined area, you can still use the area search, but need to set up two templates; one which is displayed if you are ‘in’ the feature and another which is displayed if you are ‘out’ of the feature.
The map of Green Belt land in the UK only covers certain areas.

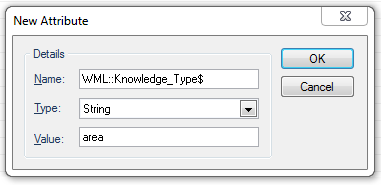
To see if you are in Green Belt zone you need to add the property WML::Knowledge_Type$ to the overlay containing the greenbelt data and give it the value area (for details on how to add a property see Adding a property section on this page) this defines the layer to be used for an area search:
Because you are simply running a test to see if you are in or out of an area, you are not returning any attributes. So you do not need to tick any MapTip options on.
These html templates can be used to display if the search point is in or out of a green belt:
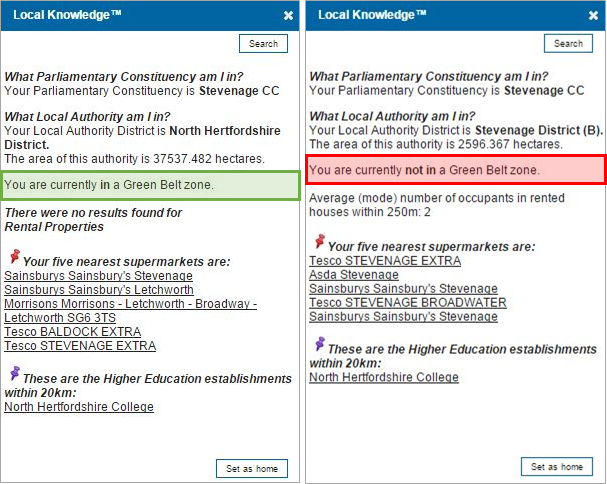
- <div>You are currently <b>in</b> a Green Belt zone.</div> </br>
- <div>You are currently <b>not in</b> a Green Belt zone.</div> </br>
If you wish to include attributes, these can be added as part of the Template, for example, to include the name of the Green Belt zone as part of the ‘in’ response. An example of returning attributes in the template can be seen in the Continuous Dataset Worked Example.
Once the templates have been added to the Templates table of the webMapLayersConfig.db, you need to note the Template ID and in the LayerTemplates table define the “you are currently in a Green Belt zone” template as The Summary Template and the “you are not currently in a Green Belt zone” template as the Nothing Found Template.
The resulting templates will be displayed as so on the Web Map Layers 8.0 site:

|
The coloured boxes are used to display which result the template is referring to, they will not be created by the template and will not appear on the Web Map Layers 8.0 site. |
Operation 2: Local Knowledge NearestN
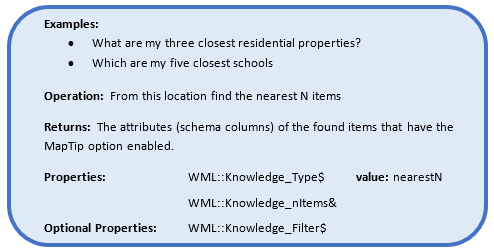
NearestN worked example: Which are my 5 nearest supermarkets?
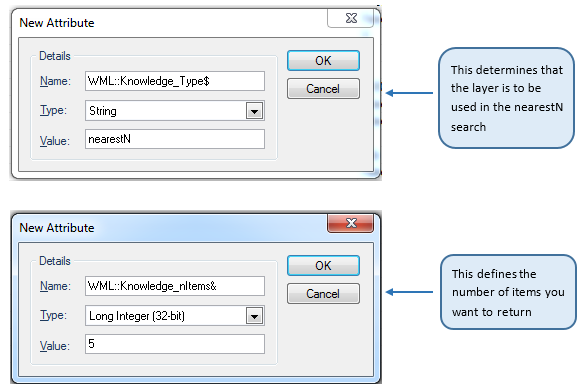
On the layers you want to run the nearestN query on add the following properties (for details on how to add a property go to the Creating an Overlay Property topic):
Optional Filter Property
The property WML::Knowledge_Filter$ applies a filter to the results that are returned by the Local Knowledge query. So for example if this query was being carried out on a dataset of supermarkets where the returned results were as so:
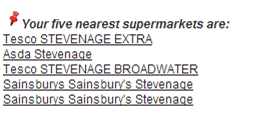
You could use the filter to return the 5 nearest Tesco’s by setting the property WML::Knowledge_Filter$ with the value SUPERMARKE$="Tesco"
To apply this filter to other queries, use the following formula as a guide: ColumnExpressionRelationalOperator”value”

|
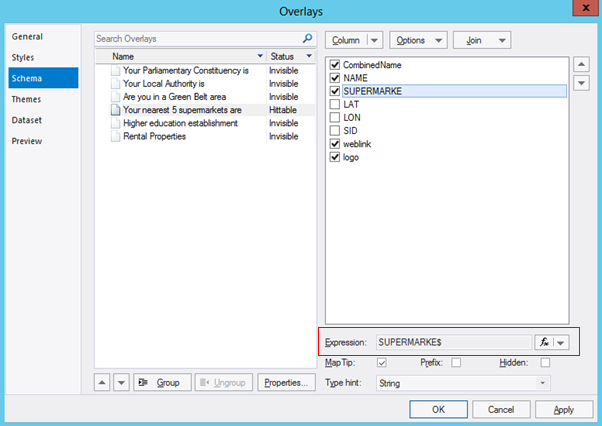
You must use the column expression NOT the column name: |
Template
Full Example:
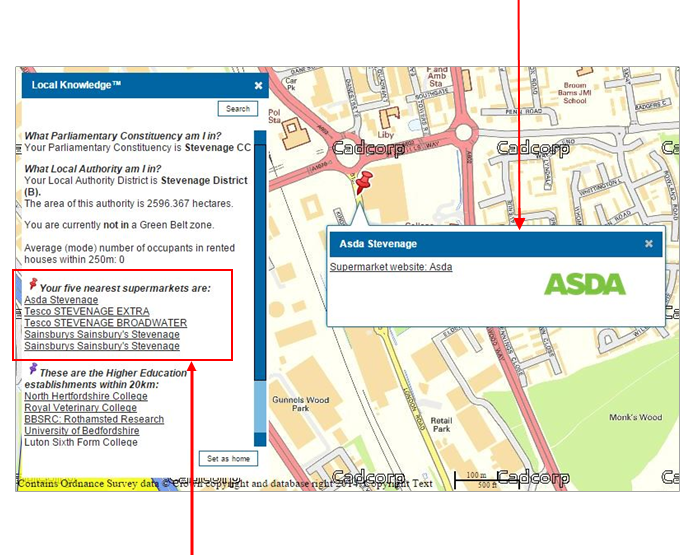
<div class="FMNContainer"><div class="supermarketContainer"><div class="columnContainer"><div class="leftColumn"><div class="supermarketLink"><a href="{Attributes[weblink]}" target="_blank" >Supermarket website: {Attributes[SUPERMARKE]}</a></div></div><div class="rightColumn"></br><img src="{Attributes[logo]}" alt="{Name}" height="27" width="100"class="supermarketImage" /></div><div class="spacer"></div></div></div><p></div>
Summary Example:
<div class="FMNSummaryContainer"><i><b><div class="FMNOverlayName"><img src="img/MapPins/MapPinGenericRed.png" height="18" width="18">Your five nearest supermarkets are:</div></b></i><div class="FMNItemContainer"><repeater {Items} ><div class="FMNItem"><a href="javascript:zoomToFMNItem({OverlayNo}, '{escape(Name)}')" >{Attributes[CombinedName]}</a></div></repeater></div><p></div>
Operation 3: Local Knowledge Distance
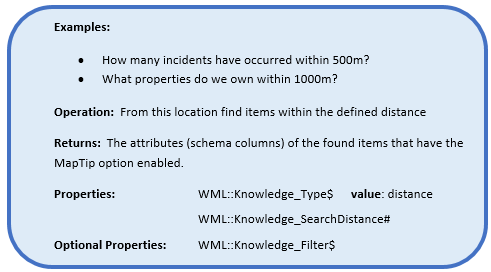
Distance worked example: How many higher education establishments are within 20km of my location?
In your Local Knowledge SWD add the following properties to the overlay you wish to run this query on (for details on how to add a property go to the Adding a property section):
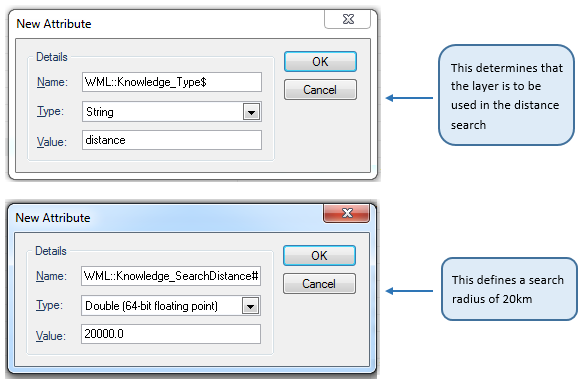
Tick on the MapTip option for any of the attributes that you want to see within the results.
Filtering the Results
It is possible to filter the results that are returned by the Local Knowledge distance query using the property WML::Knowledge_Filter$. For more information on this see Optional Filter Property.
Template
Full Example:
<div class="FMNContainer"> <b>{Attributes[Institute]}</b> is in {Attributes[District]}.</div>
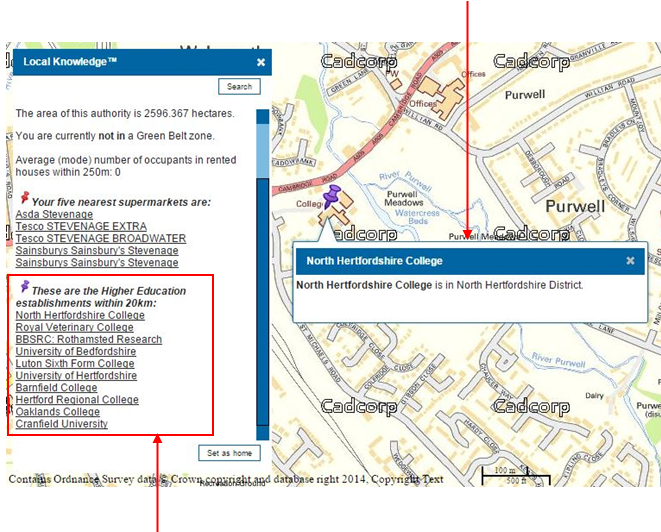
Summary Example
<div class="FMNSummaryContainer"><i><b><div class="FMNOverlayName"><img src="img/MapPins/MapPinGenericPurple.png" height="18" width="18">These are the Higher Education establishments within 20km:</div></b></i><div class="FMNItemContainer"><repeater {Items} ><div class="FMNItem"><a href="javascript:zoomToFMNItem({OverlayNo}, '{escape(Name)}')" >{Attributes[Institute]}</a></div></repeater></div><p></div>
Operation 4: Local Knowledge Statistics
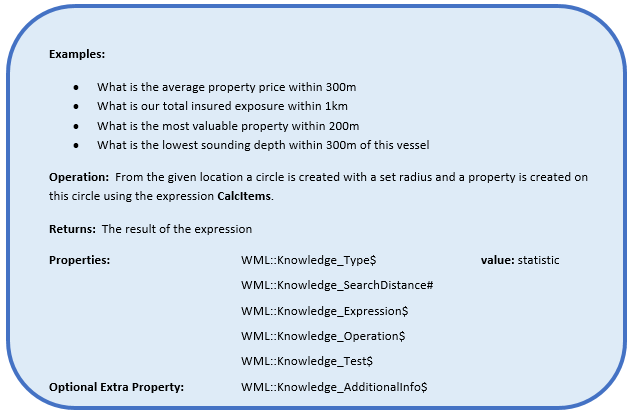
For the given location Web Map Layers 8.0 uses the values set for each of the properties to carry out an expression and return a statistic.
The expression used is the Calcitem expression, it is defined in desktop SIS as:
CalcItems(Overlay(«name», {«filter»}), «expressionorproperty», «operation», «spatialtest», «geometrytype», «geometry»)
You can see from this expression where some of the required properties are derived from:
- Overlay(«name», {«filter»}
This is defined by the layer which the other properties are added to.
- «expressionorproperty» - WML::Knowledge_Expression$
This defines the overlay column on which the expression will be executed.
- «operation» - WML::Knowledge_Operation$
Sets the mathematical operation to be carried out.
- «spatialtest» - WML::Knowledge_Test$
Defines the spatial relationship between the data and the search area.
- «geometrytype», «geometry»
This will be set to ST_Geometry, so that the expression will use the ‘current’ geometry (the geometry created when the search distance is defined) to perform its calculations.
The installed site is set up to calculate the Mode (most common) number of residents per property within the 250m radius. The following example goes through how that is set up.
Statistic worked example: What is the most common number of residents in each property within 250m?
The data used here is a fictitious national dataset with the following attributes:
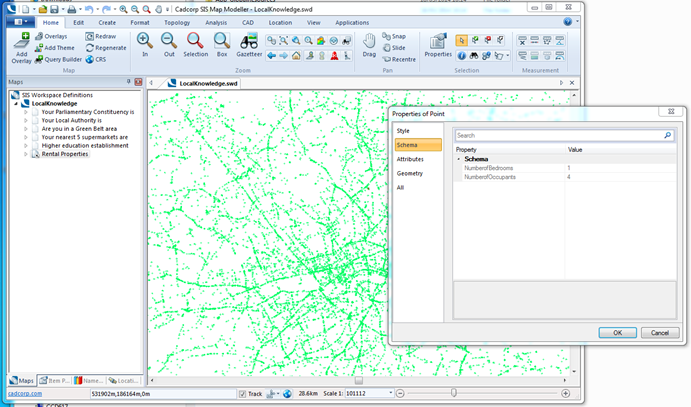
Setting the Property Values
Firstly you need to define the overlay to be used in the statistic query and set the search distance for the query to be run within (for details on how to add a property go to the Adding a property section):
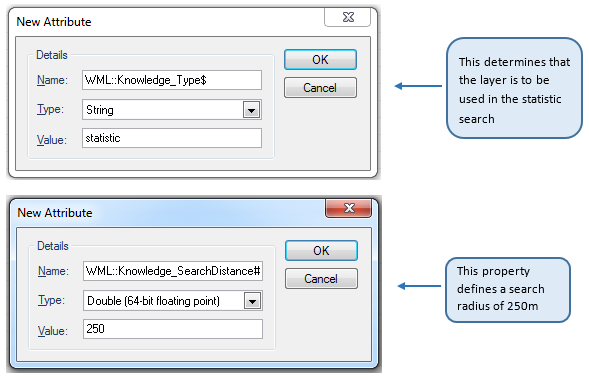
Building the Expression
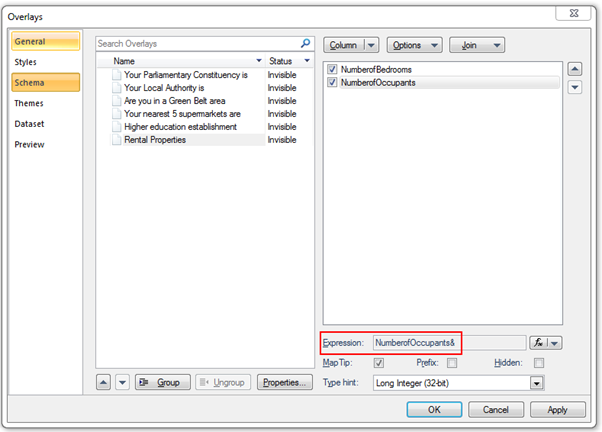
This property identifies the overlay column on which the expression will be executed:

Note: You must use the Expression rather than the Column Name, so in the example below you would need to use NumberofOccupants& and not NumberofOccupants.
Operation
This sets the mathematical operation which is to be carried out on the data (NumberofOccupants) that falls within the 250m search distance. Available operations are:
OP_Count - The number of results.
OP_Sum - The sum of the results.
OP_Min - The minimum result value.
OP_Mean - The average of the results.
OP_Median - The middle number in the list of results.
OP_Mode - The number which appears most often in the results.
OP_Max - The maximum result value.
OP_Stddev - (Standard Deviation) a measure of the spread of the results.
OP_Variance - The average of the squared differences from the Mean value.
OP_Skewness - Reduces any positive or negative skewing of the results.

Spatial Test
This defines the spatial relationship between the data and the search area for the resultant statistic. In this example the value is ST_Intersect, so the expression will work out the Mode (most common value) of the dataset which intersects with the search area. Available spatial tests are:
ST_Contains - Does the data intersect with the search area?
ST_Crosses - Does data cross the search area?
ST_Disjoint – Is the data disjointed from the search area, do they not intersect in any way?
ST_Equals - Is the data equal to the search area?
ST_Intersect - Does the data intersect the search area?
ST_Overlap - Does the data overlap the search area?
ST_Touches - Does the data touch the search area?
ST_Within - Is the data within the search area?

The values set will create the following expression, which will return a statistical value:
CalcItems("Rental Properties"),{NumberofOccupants&},OP_Mode,ST_Intersect,ST_Geometry)
HTML Template
The template used to display the results of the Local Knowledge statistic query has the following structure:
<div>Text to describe the result {Statistical Result}</div><br>
So for the example described above to be displayed on the web map layers site, the following template needs to be present in the Templates table of the config.db:
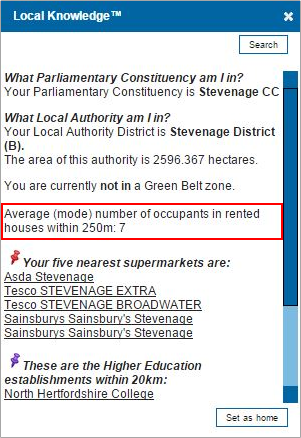
<div>Average (mode) number of occupants in rented houses within 250m: {Items[0].Attributes[CalcItem]}</div><br>
This will result in the following output on your Web Map Layers 8.0 site:
Additional Info Parameter
To give extra context to the result that is returned from the local knowledge statistic query, the following additional property can be used:
WML::Knowledge_AdditionalInfo$
This property runs a query on the result of the statistic.
EXAMPLE:
Local Knowledge Statistic Question: What is the most common number of residents in each property within 250m?
Answer Returned: 4
Currently there is no explanation of this result, the user doesn’t know if this is a good or a bad result, or how it relates to their investigation.
Consider for example if the user is looking to carry out a survey on people living alone in rented property, this value could give a preliminary indication of whether it is worth visiting the area to carry out research. If the result is greater than or equal to two, then there is less likely that there are many single occupancy households in the area.
This result can be queried using an iif statement. An iif statement determines if an expression is true or false, if it is true it returns one value, if it is false it will return another value:
Iiff(LocalKnowledgeExpression) statement,“returned value if true”,“returned value if false”)
So using the example above, if the result of the expression shows the most common number of people in a household is greater than or equal than two, it is less likely that there are many single occupancy households in that area.
To return this information to the user you would use the following iif statement:
Iif(CalcItems("Rental Properties",{NumberofOccupants&},OP_Mode,ST_Intersect,ST_Geometry)>= 2,"Low probability of single occupancy households","High probability of single occupancy households")
It is this iif statement that is used as the value for the property:

HTML Template
If using the Additional Information Property an addition also needs to be made to the template so that the result is displayed on the site.
Structure of original template:
<div>Text to describe the result {Statistical Result}</div><br>
Structure with additional information:
<div>Text to describe the result {Statistical Result}<br />{Additional Information}</div><br>
Actual HTML code required for the example used in documentation:
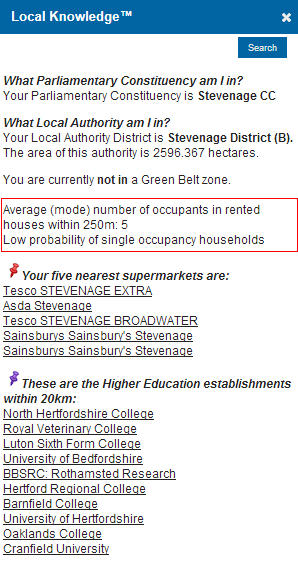
<div>Average (mode) number of occupants in rented houses within 250m:
{Items[0].Attributes[CalcItem]}<br />{Items[0].Attributes[AdditionalInfo]} </div></br>
Send comments on this topic.
