Debugging
In-process GisLink Add-In applications run inside a SIS Desktop process.
To run an assembly library from Visual Studio, ensure Cadcorp SIS Desktop is open.
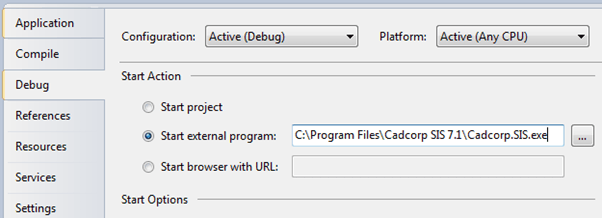
Browse for the Cadcorp.SIS.exe on the Debug page of the Microsoft Visual Studio Project Designer. This will start the SIS desktop when Debugging is started from the Microsoft Visual Studio interface.
To run the GisLink add-in in this process remember to create a shortcut for the assembly library in the SIS custom directory.
If the SIS desktop is started from Visual Studio then the current project will already be linked to the process and Microsoft Visual Studio should stop at the first breakpoint.
It is also possible to launch a debugger from within the GisLink code.
Note: Remove this line before releasing the application.
SIS = e.Desktop
Try
System.Diagnostics.Debugger.Launch()
SIS.EmptyList("aList")
Catch ex As Exception
MsgBox(ex.ToString)
End Try
SIS.Dispose()
SIS = Nothing
End Sub
If the debugger is launched (on the developer machine) a Visual Studio Just-In Time Debugger dialog allows the selection of a possible debugger. This can be the current open Cadcorp SIS Desktop project.
After selecting a possible debugger the Visual Studio debugger control will be available to step through the code.
Cadcorp recommends showing the Developer Control Bar  when debugging GisLink code. This control bar reports all GisLink method calls, triggers and errors.
 takeover request received.gif)
Reporting code in the Developer Control Bar will slow down the application.