Hot Spot
Hot Spots can help you visualize geographic data easily. For instance you can use a 'Hot Spot' Grid to highlight areas which report more burglary incidents.
For both types of spatial analysis, a colour gradient is used to indicate areas of increasingly higher density.
Select Analysis > Grids > Scatter Grid.
This opens the Choose Hot Spot Type dialog:
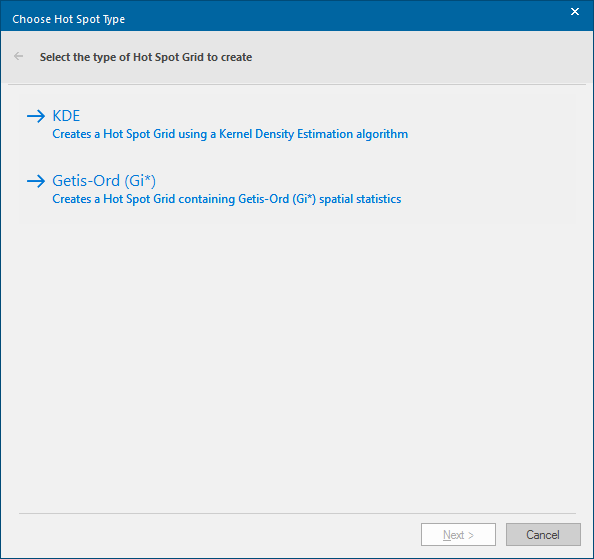
- KDE - Creates a Hot Spot Grid using a Kernel Density Estimation algorithm. Click here for a description of creating a KDE Hot Spot Grid.
- Getis-Ord (Gi*) - Creates a Hot Spot Grid using the Getis-Ord (Gi*) spatial statistics. Click here for a description of creating a Getis-Ord (Gi*) Hot Spot Grid.
Points to consider when selecting the type of Hot Spot Grid to create:
- Getis-Ord (Gi*) is a more statistical method than KDE, it will ignore any hotspots it deems to be outlying. This means it is better at recommending the most important areas to target resources.
- Getis-Ord (Gi*) highlights both hot and cold spots as opposed to just hotspots with KDE. This will identify areas where incidence is low as well as where it is high.
- Getis-Ord (Gi*) tends to give a better Predictive Accuracy Index (PAI) score when predicting the future location of crime than all other spatial analysis methods, including KDE.
- Getis-Ord (Gi*) allows a theme to be set to the standard confidence intervals regardless of the data used, the output map will not be significantly affected by the choice of colour scheme intervals etc.
- Getis-Ord (Gi*) should ideally be used to complement KDE rather than replace it, with Getis-Ord (Gi*) being used to highlight important areas and KDE being used to investigate these areas further.
- Getis-Ord (Gi*) is particularly useful when dealing with fields which have a strong spatial connection (crime data, voting analysis, retail analysis, etc.)