Spatial Analysis- KDE
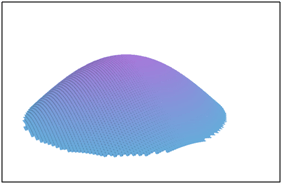
KDE (Kernel Density Estimations) Hot Spots are modelled surfaces which describe the spatial distribution of point locations. A hotspot map can describe the relative, or absolute distribution of point events or their probability. Hot spot maps are useful for investigating the distribution patterns and their underlying causes in large record datasets (e.g. crime, fire, health).
Cadcorp SIS Desktop Kernel Density Estimations (KDE) allows the modelling of a continuous surface from discrete event points. Unlike the scatter grid, the KDE surface elevation will not describe a z value which is interpolated from a series of survey points.
Note: See also KDE Hot Spot
A KDE model surface describes the relative density of point events. Density and distribution patterns can be used in the investigation of underlying causes. The first notable application of this theory being the investigation of cholera in London (1854), with the pattern leading to the identification of a sewage-polluted well on Broad Street as a possible cause for the outbreak (John Snow, 1813 – 1858).
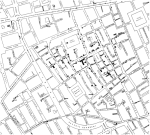
C.F. Cheffins, Lith, Southhampton Buildings, London, England, 1854 in Snow, John. On the Mode of Communication of Cholera, 2nd Ed, John Churchill, New Burlington Street, London, England, 1855.
In forecast and planning applications, KDE is used to determine probabilities. KDE is a proven technique in social and physical sciences and is used for example for the investigation of geological events (e.g. earthquakes, volcanic plumes), health (disease), and crime (theft, burglary).
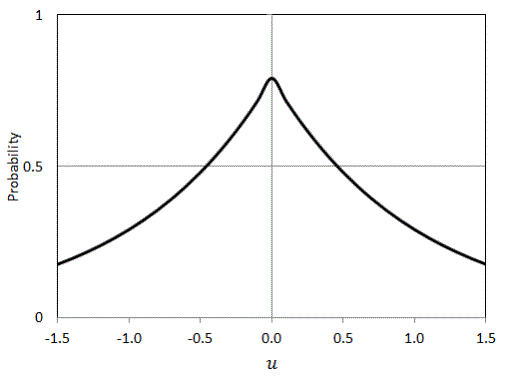
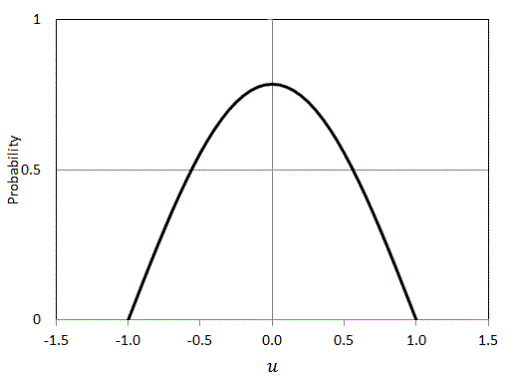
Cadcorp SIS Desktop applies a kernel on each point location from the input data series to determine the relative point density. The shape and bandwidth of the analysis kernel is user defined and will determine the coarseness and modality of the KDE model surface. Different kernel shapes will have much less impact on the analysis result than a change in bandwidth.
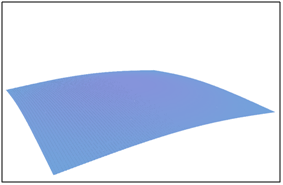
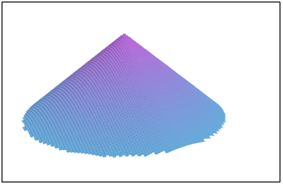
The different kernel shapes which are available in Cadcorp SIS Desktop are:
|
Normal Distribution (Gaussian)
|
 |
| Quartic (Spherical)
|
_513x382.gif)
|
Negative Exponential

 diagram1.gif)
|
|
|
Negative Exponential (bounded)
|
_513x377.gif)
|
|
|
_514x376.gif)
|
|
|
_506x372.gif)
|
|
|
_502x374.gif)
|
|
|
_492x362.gif)
|
|
|
|
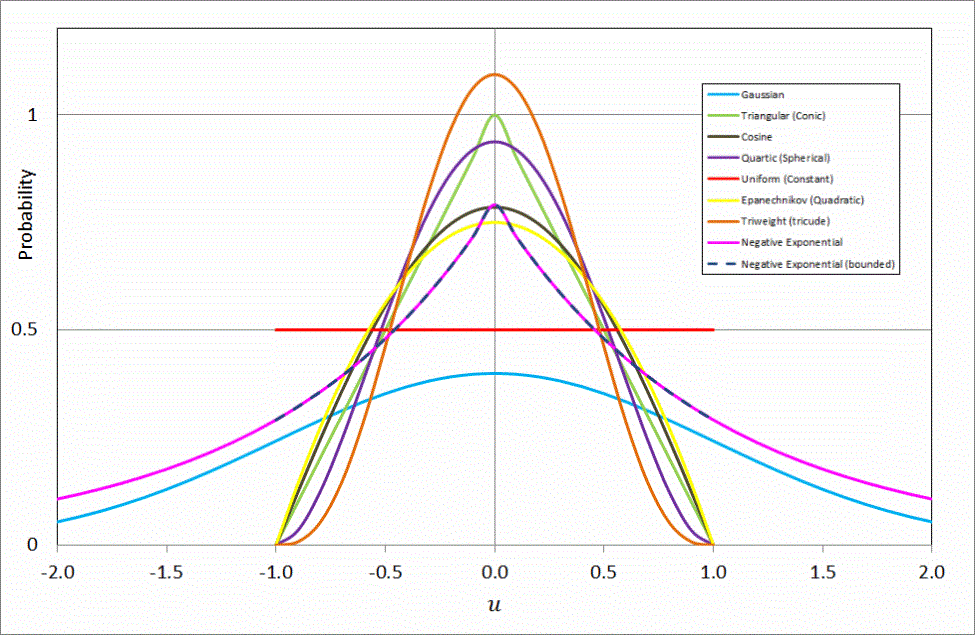
A kernel is a non-negative real-valued integrable function K satisfying the following two requirements:
- The first requirement ensures that the method of kernel density estimation results in a probability density function.
- The second requirement ensures that the average of the corresponding distribution is equal to that of the sample used.
If K is a kernel, then so is the function K* defined by K*(u) = ?-1K(?-1u), where ? > 0. This can be used to select a scale that is appropriate for the data.
1{…} is the indicator function.
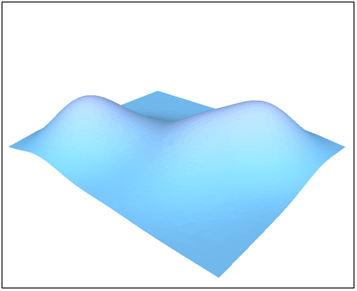
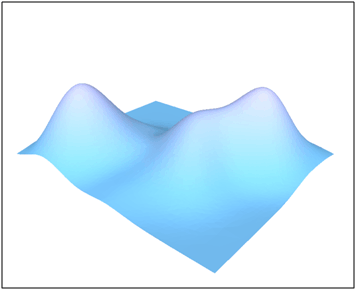
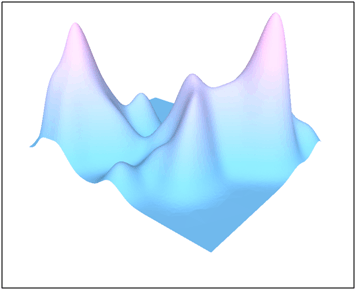
More important than the kernel shape is the kernel bandwidth. A higher bandwidth will result in a smoother uni-modal surface where detail might be lost. A small bandwidth results in a multi-modal surface which is too coarse for the investigation of underlying phenomena.
The SIS KDE tool provides the option to define the kernel bandwidth based on the k-mean nearest neighbour distance of the input dataset. The best fit k is dependent on the number of locations and their distribution pattern. A k between 1 and 10 is often appropriate. It is recommended to run the analysis several times and conduct a visual check of the KDE analysis surface.
Sample KDE (k = 10) resulting in a surface which is too smooth for an analysis:
Sample KDE (k = 5) resulting in a good model surface.
Sample KDE (k = 1) resulting in a coarse, ridged, model surface.
Events in the incident dataset can be weighted for the KDE analysis. If a weight is applied to the dataset it is assumed that certain points are more important for the analysis than other points. A crime dataset which has been filtered for social unrest and number of arrests per incident could be used to investigate causes of social unrest. In this case the number of arrests can be used to weight the discrete incidents in the dataset.
KDE weighting must not be confused with scatter grid interpolation. In the above example an interpolated surface would indicate many arrests close to a recorded incident with multiple associated arrests. KDE will regard an event with a weight of 3 like 3 individual events with a weight of 1 each.
KDE for exampleis used in earth sciences to determine volcanic hazard. Volcanic hotspots are monitored via the MODISsatellite platform. The data is processed and made available through MODVOLC at the University of Hawaii. The hotspot data can be download as a comma separated CSV file which SIS is able to display as a View Points overlay in the Lat/Lon WGS84 map projection.
Due to the nature of volcanic hotspots a negative exponential kernel is suitable for the KDE analysis.
An initial visual interpretation has determined that a k-mean nearest neighbour distance from 10 points (0.097°) is a good fit for the kernel bandwidth.
Volcanic hotspots can be weighted according to the measured magnitude of the hotspot event.
Based on the spatial extent of the input dataset a resolution was chosen which results in a moderately sized grid (500k+ cells).
SIS can be used to create a two-pair colour-set. The min and max grid values are assigned in the colour-set. Intermediate values can be blended for a smooth graphic representation.
Applied to a record of volcanic hotspots for Distrito Federal, Mexico (2009-2010), the KDE surface can be exported from SIS as raster file and overlaid to the topographic base data in Google Earth. This visual interpretation clearly identifies the active volcano Popocatepetl, south-east of Ciudad Mexico.
KDE analysis of volcanic hotspots in Mexico:
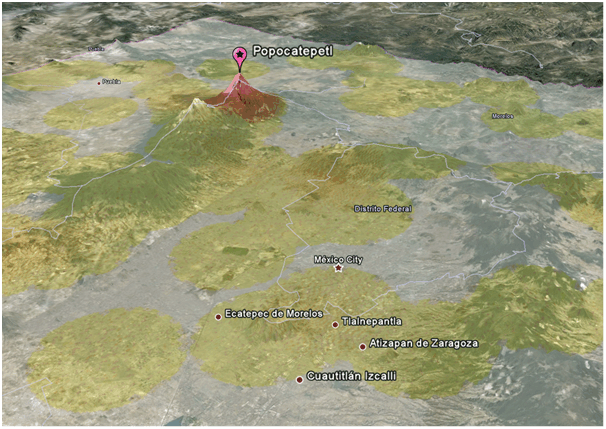
©2010 Google Earth

 formula.gif)
 diagram.gif)
 diagram2.gif)



 formula.gif)
 diagram.gif)
 formula.gif)
 diagram.gif)

