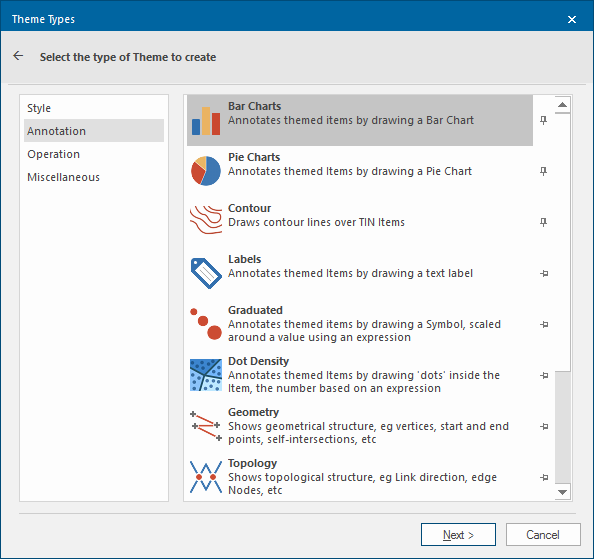
Bar Charts
The Bar Charts theme is part of the Annotation theme type and is used to compare the values of several properties.
The height of the bar chart blocks are proportional to the value of a chosen property or expression.
Click Home > Add Theme > Annotation and select Bar Charts.
Click Next to set the Properties/Expressions.
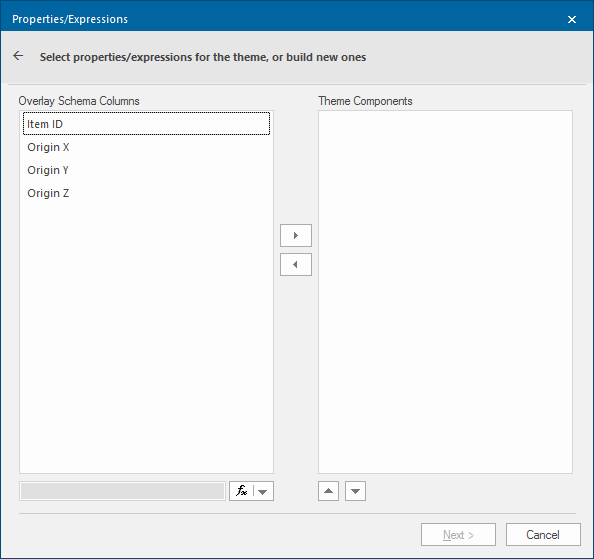
To include schema columns as a theme components, simply select them and use the arrows.
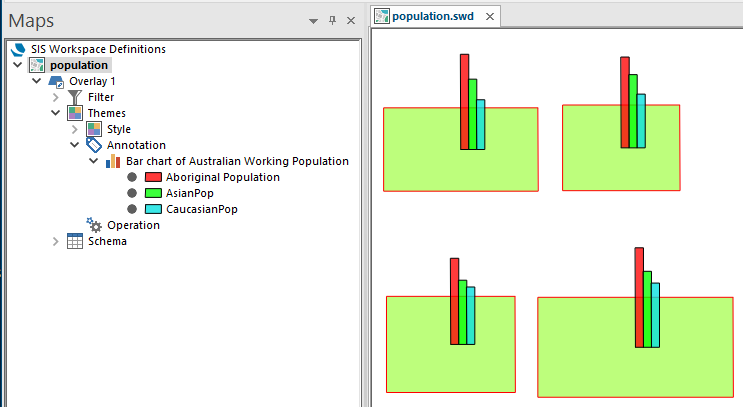
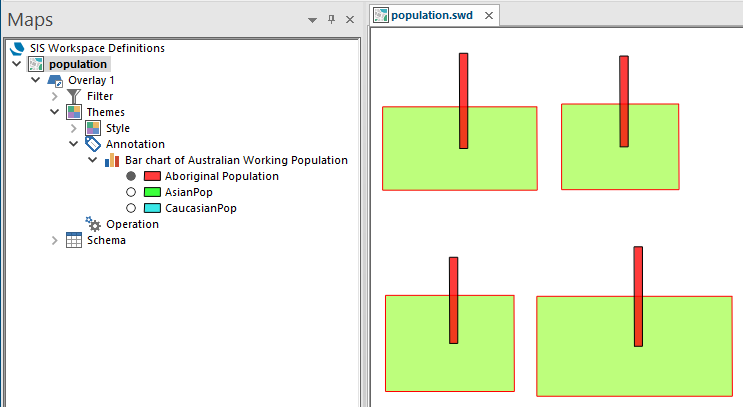
The following example uses Australian census data to compare the numbers of different ethnic groups in each state.
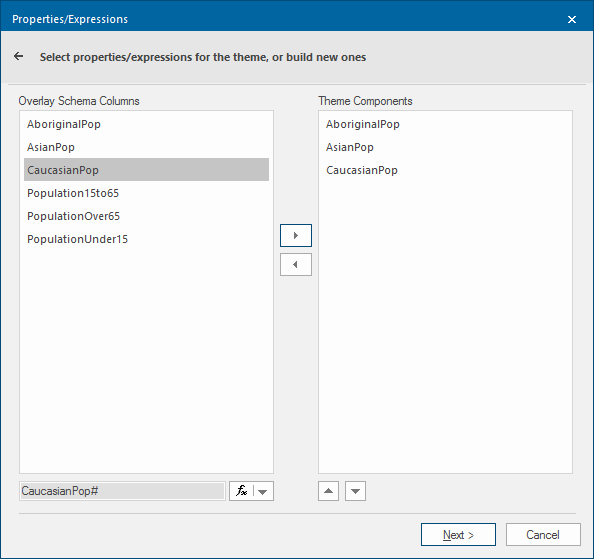
Click Next.
The Do you want to search the Overlay for existing values? query will be displayed
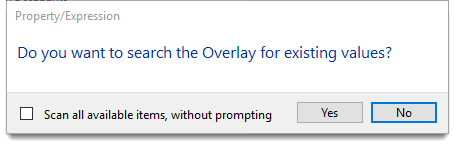
- If you check the Scan all available items, without prompting tickbox you will not be asked again during the current session.
- If you are repeating the process you will be asked Do you want to clear the Theme and search the Overlay for existing values? again you can set to scan all available items, without prompting.
Click Yes to open and edit the Bar Chart Styles.
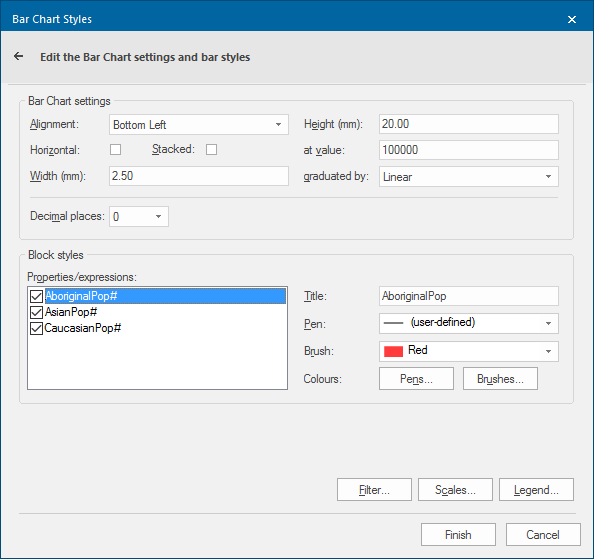
| Option | Description | |
| Alignment |
Allows you to choose where the bar chart should be placed in relation to the item’s centre, or hook point. The default is Middle Centre: 
Check the Horizontal tickbox to align the blocks horizontally. Check the Stacked tickbox to stack the bars either vertically or horizontally. The following diagrams show the effect of the Horizontal and Stacked tickboxes:
|
|
| Width (mm) |
Enter a Width (mm) for the bars in millimetres (all bars use this same width). |
|
| Height (mm) |
This is the height of a bar chart block when it is at value (below). Valid values range from 0.01mm to 500mm and are heights on screen or paper. |
|
|
at value |
This is the base value around which the block is scaled up or down. An item with this value will be represented by a block of the height shown in the Height field. If the value is less than this, the block will be shorter; if greater, the block will be taller. The graduated by setting determines the of scaling of the block height. |
|
| graduated by |
Square root - the block height is proportional to the square root of the ratio (this is the ratio of the evaluated block value to the at value). Linear - the block height is proportional to the ratio. Log (base-10) - the block height is proportional to the log (base 10) of the ratio when the value is greater than or equal to the value given in at value and is proportional to the ratio when the value is less than the value given in at value. |
|
| Decimal places |
This is the number of decimal places in the value, e.g. as shown in the legend. |
|
| Title/Pen/Brush |
Highlight each attribute name in the Properties/expressions panel and either accept the displayed Title, Pen and Brush settings for each attribute or change as required. The attribute tickboxes control if the bar for the selected attribute will be displayed, i.e the button next to the attribute in the Maps Control Bar bar chart theme will be "on". These tickboxes have the same effect as selecting and de-selecting the button next to the attribute names in the Maps Control Bar. The following diagram shows the effect with all attribute tickboxes checked:
|
|
| Colours | Pens Displays the Pick Colours dialog Brushes Displays the Pick Colours dialog |
|
Filter, Scale and Legend buttons
Note: Click here for Bar Charts Theme properties.