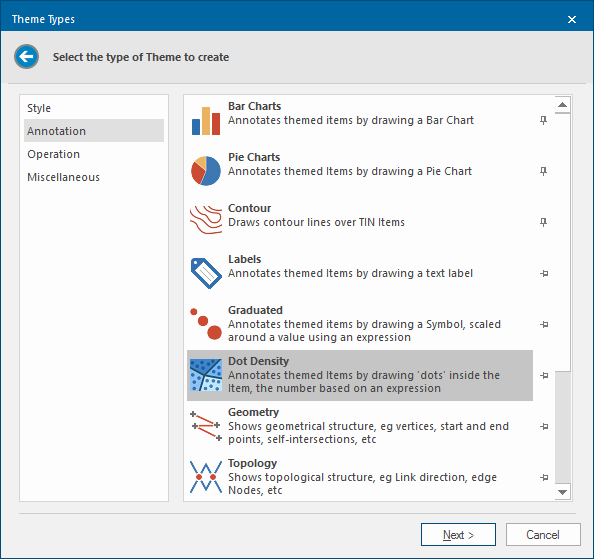
Dot Density
The Dot Density theme annotates themed items by drawing a number of 'dots' inside the item, the number depending on the result of an expression.
Click Home > Add Theme > Annotation and select Dot Density.
Click Next to set the Properties/Expressions.
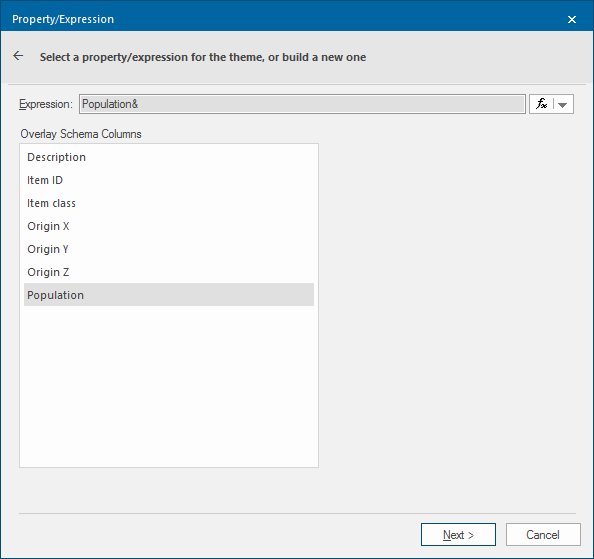
For eg if a schema column called Population has been added to the overlay and is now selected, the Property/Expression dialog will be:
Click Next.
The Do you want to search the Overlay for existing values? query will be displayed
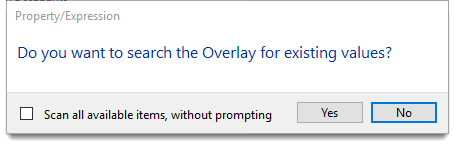
- If you check the Scan all available items, without prompting tickbox you will not be asked again during the current session.
- If you are repeating the process you will be asked Do you want to clear the Theme and search the Overlay for existing values? again you can set to scan all available items, without prompting.
Click Yes to open and edit the Bar Chart Styles.
The Dot Density Styles dialog will be shown:
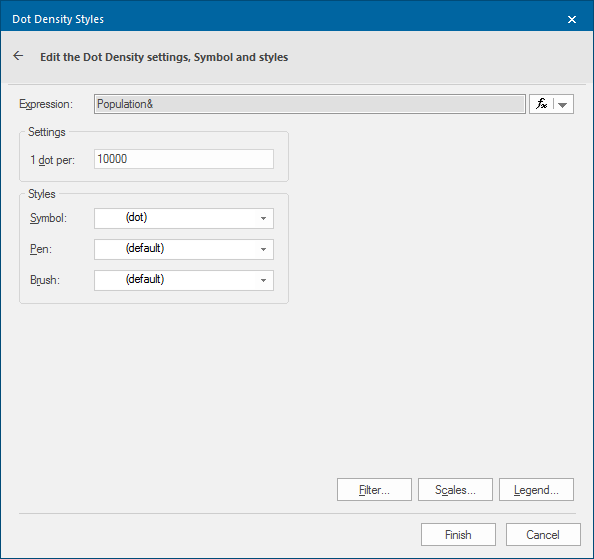
Click Finish.
The Dot Density theme is an example of choropleth mapping. This theme fills polygons with dots to show the value of a property or expression. The density of the dots in the different polygons gives an immediate visual indication of the spread of data.
Filter, Scale and Legend buttons
Note: Click here for Dot Density Theme properties.