Create a Report
The Cadcorp SIS WebMap for Power BI visual works with either the desktop or web deployment of Microsoft Power BI.
- Cadcorp will provide the visual as a .pbiviz file. This can be stored anywhere on your local machine.
-
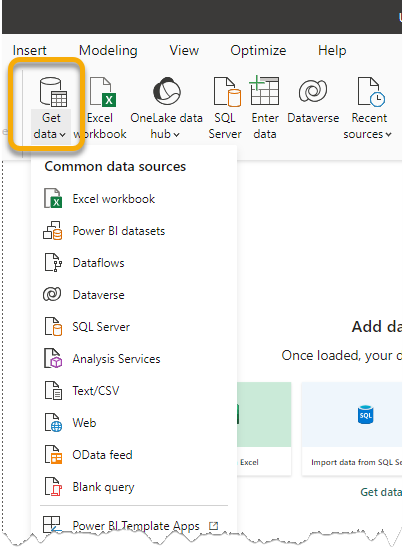
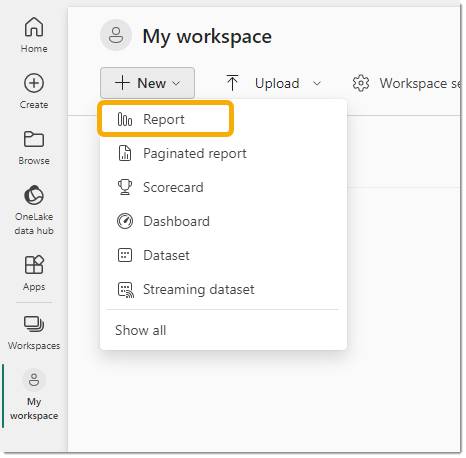
To use the visual, create or use an existing Report. There are a number of ways to do this but they are all based around a Dataset. The quickest way to start is to Get Data (Power BI Desktop and Web) or Create a Dataset (Power BI Web).
NOTE: The dataset must contain coordinates that match the coordinate reference system of the data displayed by WebMap. For example:
- If the map is served using British National Grid (EPSG 27700) or Pseudo-Mercator (EPSG 3857), the Power BI dataset must contain easting and northing fields.
- If the map is served using WGS84 (EPSG 4326) the dataset must contain Latitude and Longitude fields. Data is not transformed, it is simply displayed over the map without being exported outside the Power BI environment.
- You can also use data from other sources including Files and Databases or existing content. Use the Workspace inside Microsoft Power BI to load your custom data, then create a report.
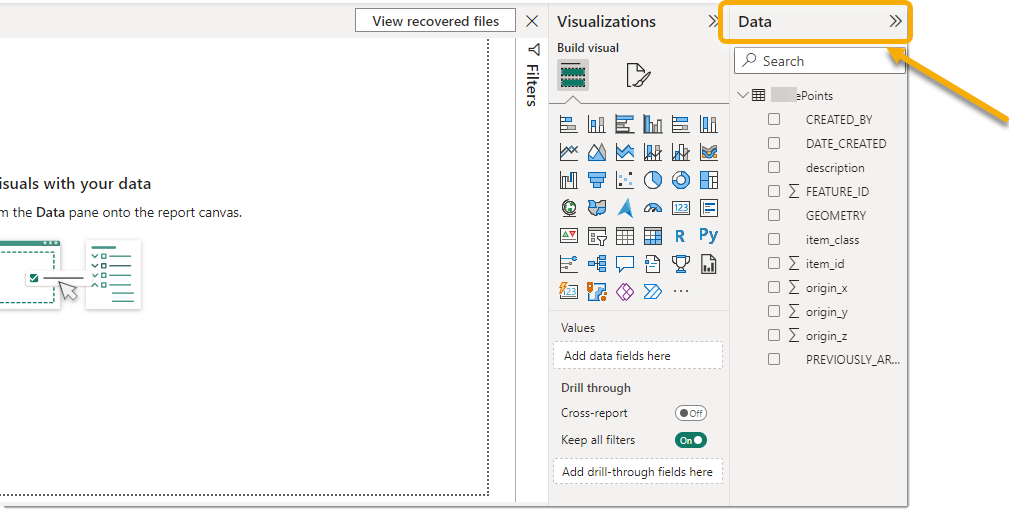
- This should display a blank Report; the fields of the dataset you want to use are displayed under the Data heading.
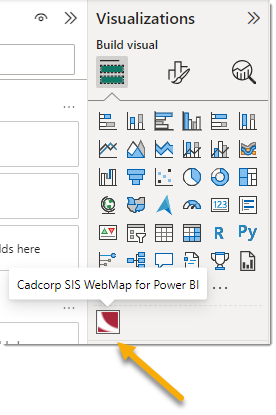
- Now add the Cadcorp SIS WebMap for Power BI visual. Navigate to the VISUALIZATIONS panel and click on the 3 dots to import a custom visual.
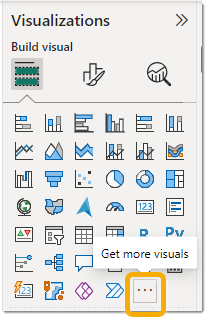
- From the menu, select the Import a visual from a file option and browse to the location of the WebMap.pbiviz file. This creates a new icon in the VISUALIZATIONS panel.
NEXT: Fields Settings ![]()