Field Settings
- To view data from WebMap 9.1, you must first add this data to the visual.
- Click on the WebMap visual and draw an area onto the Report to create a tile. Ensure the tile and the Build Visual tab are selected.
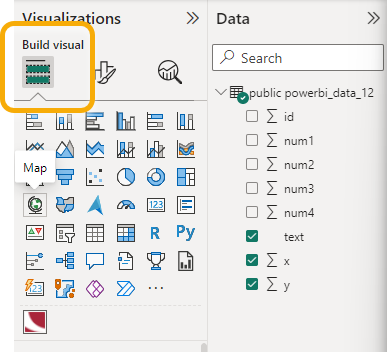
- In the Data tab click the dropdown on your data. Data fields can be toggled on or dragged into the relevant boxes.
- Optionally, you can add other data columns into boxes to enhance the visual.
- Click and hold on the FIELD which contains the Easting (or Longitude) value and drag the FIELD into the text box for the X (Easting/Longitude).
- Do the same for the Northing FIELD, dragging it into the Y (Northing/Latitude) text box.
- Adding the columns containing the X and Y coordinates for point data (or the GeoJSON for polygon data) activates the visual and reveals Format options.
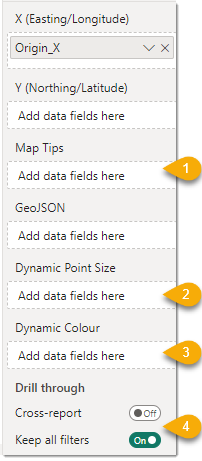
- Map Tips: Map tips are displayed when the user hovers over a data point or polygon. They are displayed in the same order as in the box. Multiple fields can be added to the Power BI visual data by dragging them into the Maps Tips box.
 Related Topics
 - Dynamic point size: Field data can be visualised dynamically on the map based on the values of each feature. Higher values will be displayed as larger points. The range of sizes can customised in the Points tab.
- Dynamic colour: Discrete data fields can be visualised dynamically based on a colour range. Drag the field into the box and set a theme colour, spectrum and number of shades in the points tab.
- Drill through: Add fields that can be used for filtering when drilling through to the report.
- Cross report allows other reports to select the WebMap visual as a drill-through destination in Power BI. This is useful to display geospatial data between Power BI reports.
- Enable Keep all filters to only filter to these fields. Alternately this can be enabled at all times but no fields added.
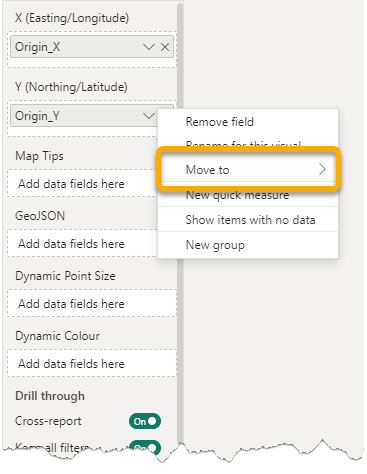
You can change which column is associated with each field by clicking on the dropdown > Move to and selecting the field (or by dragging it between columns). You can also rename or remove columns for the visual.
NEXT: Format Settings ![]()