Using the data
Begin by importing the data into Power BI. 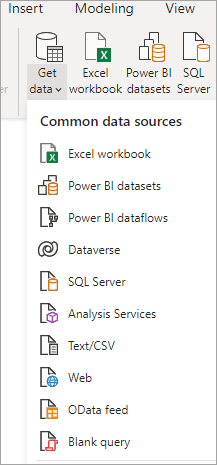
The Import process does not require any special transformations. For e.g. GeoJSON fields are automatically imported as Text. After import, you can see all the fields in the Data panel.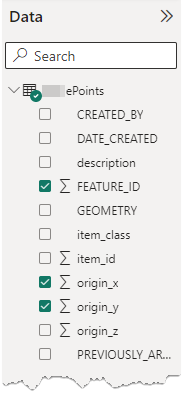
Add the WebMap for Power BI visual and add to the Report. With the visual selected, click and drag the relevant fields from the Data pane to the Visualizations pane. For e.g. drag the GeoJSON field to the GeoJSON property dialog.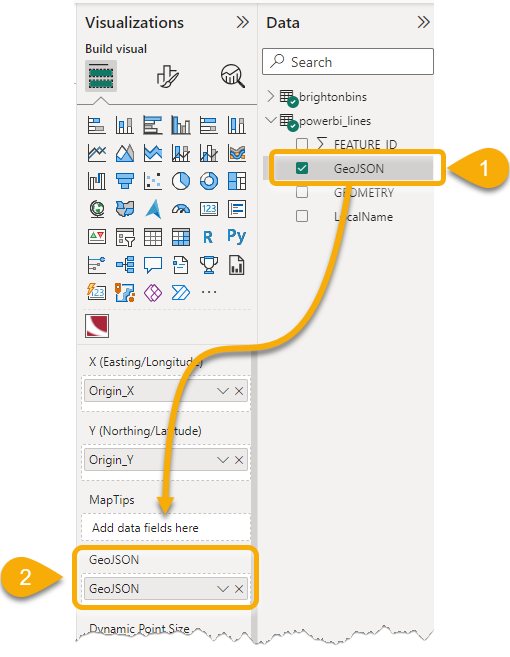
You can then customise the settings to edit the style of the polygons.