Analysis (Process operations)
Select Create > Process > Analysis.
Calculates the cumulative percentage of Items from another Overlay nearest the input Items. Use this process to associate point data (e.g. crime incidents) with the closest line or polygon features (streets or districts).
For example, starting with an Overlay containing a network of roads, and another Overlay of locations of incidents, assign each incident to the nearest road, and then calculate the cumulative count and percentage of incidents on each road (from largest, ie most incidents, to smallest, ie fewest incidents), in order to test the Pareto Principle.
| Property | Description | Value | |
| Incidents Overlay | The name of the Overlay containing the Items to analyse | _overlay$ | |
| Filter | A filter expression, eg '_FC& IN (1,2,3)' or 'IncidentType$ IN ("RTC","RRO")', to use when looking for Items | _filter$ | |
Note: 80/20 refers to the small percentage of locations or features that can account for a large percentage of events or outcomes. Data outputs can be Cumulative/Incident/Percentage, Cumulative/Location/Percentage and Incident/Percentage.
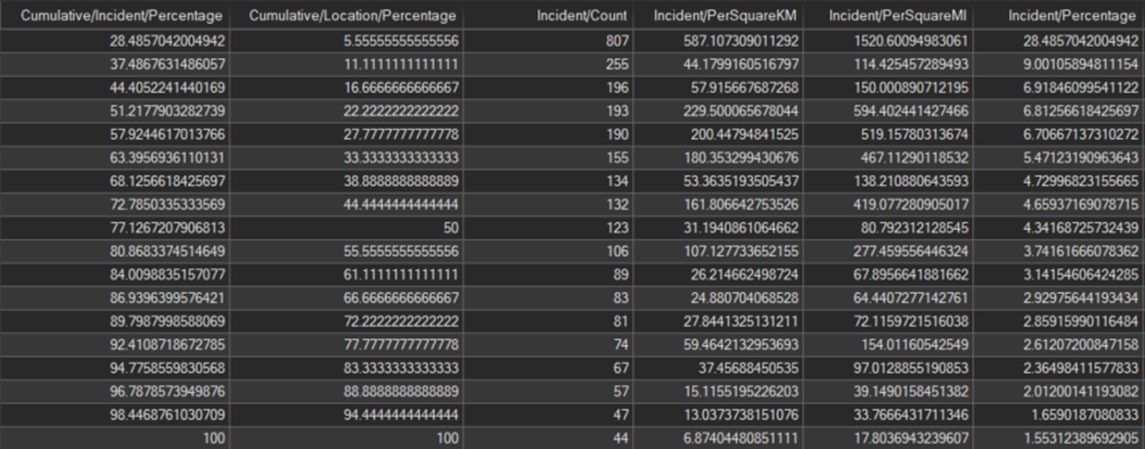
Calculates the cumulative percentage of Items within DBSCAN (Density-based spatial clustering of applications with noise) clusters.
For example, starting with an Overlay of locations of incidents, create DBSCAN  clusters, and then calculate the cumulative count and percentage of incidents in each cluster (from largest, ie most incidents, to smallest, ie fewest incidents), in order to test the Pareto Principle.
| Property | Description | Value | |
| Minimum number of Items | The minimum number of nearby Items (the 'density') required to classify a cluster point, as a simple property name, or as an expression, eg '5' or 'density&' | _minPts@ | |
| Radius | The cluster radius, as a simple property name, or as an expression, eg '12.34' or 'Max(123.4,range#)' | _radius@ | |
This process operation is similar to 80-20 Analysis- Closest Feature (see above) but gathers the point data into clusters and validates it against the 80-20 rule.
Data outputs can be Cumulative/Incident/Percentage, Cumulative/Location/Percentage, Incident/Percentage and Incident/Count.
Creates a buffer around an Item.
Radius*: The buffer radius as a simple value or as an expression.
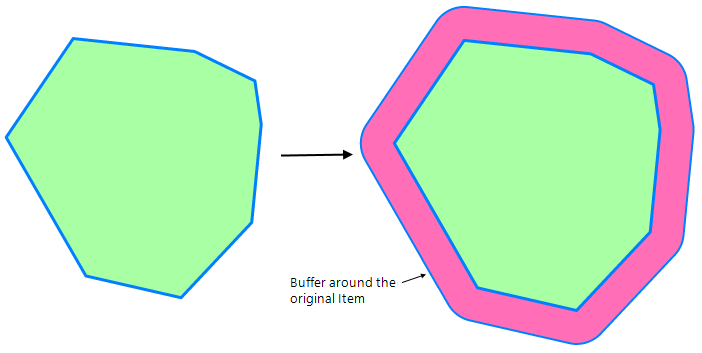
See also Buffer command.
Creates a buffer around the boundary of a Polygon.
Radius*: The buffer radius, as a simple value, or as an expression.
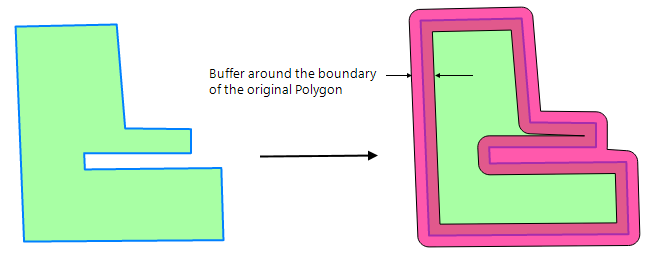
See also Buffer command.
Creates a buffer around the boundary of a Polygon that only contains the parts that are inside the Polygon.
Radius*: The buffer radius, as a simple value, or as an expression.
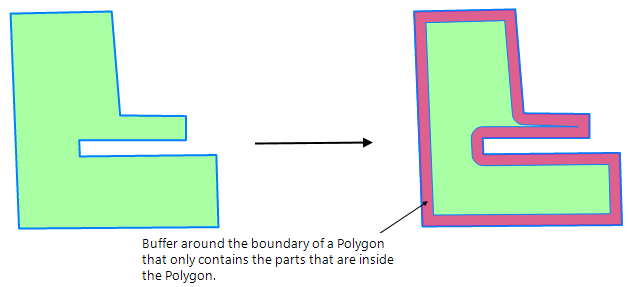
See Buffer command.
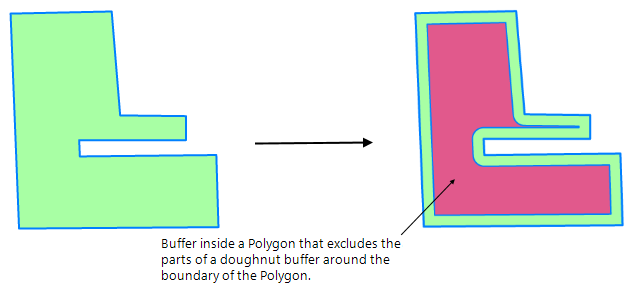
Creates a buffer inside a Polygon that excludes the parts of a doughnut buffer around the boundary of the Polygon.
Radius*: The buffer radius, as a simple value, or as an expression.
Creates a buffer around the boundary of a Polygon that only contains the parts that are outside the Polygon.
Radius*: The buffer radius, as a simple value, or as an expression.
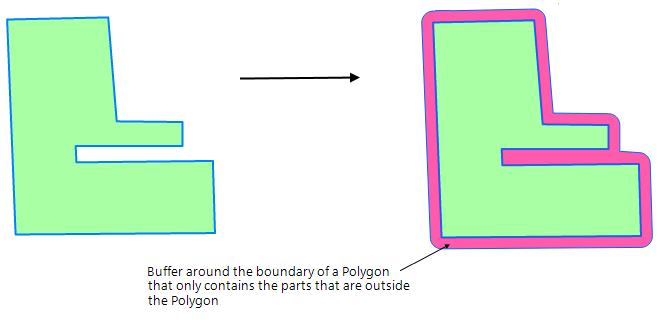
Creates a buffer around the boundary of a Polygon that only contains the parts that are outside the Polygon.
Start and End Radius*: The buffer start and end radii, as a simple value or as an expression.
Example: '12.34* or Max(123.4.Sqrt(_area#))'
Counts Items from another Overlay with origins on or near a 'network' of LineStrings, with additional classification, each Item being counted along any matching LineString
For example, starting with an Overlay containing a network of foot patrol routes, and another Overlay of locations of incidents of various types, assign each theft to all patrol routes within the maximum distance, and count each type. The result is a JSON property of types and counts, on a copy of each patrol route that has any matching incidents.
Properties are the same as Count and classify (along linear network).
Counts Items from another Overlay with origins on or near a 'network' of LineStrings, with additional classification, each Item only being counted once.
For example, starting with an Overlay containing a network of roads, and another Overlay of locations of incidents of various types, assigning each theft to the nearest road within the maximum distance, and count each type.
The result is a JSON property of types and counts, on a copy of each road that has any matching incidents.
| Property | Description | Value | |
| Expression* | The 'classification' of each Item, as a simple property name, or as an expression, eg 'IncidentType$' or 'Iif(Speed#>SpeedLimit#,"Speeding","Not speeding")' | _expression@ | |
|
Filter Expression* |
A filter expression, eg '_FC& IN (1,2,3)' or 'IncidentType$ IN ("RTC","RRO")', to use when looking for Items | _filter$ | |
|
Maximum Distance |
The maximum allowable distance away from a line, as a simple value, or as an expression, eg '12.34' or 'Max(123.4,0.1*_length#)' | _distance@ | |
|
Overlay |
The name of the Overlay containing the Items to count and classify | _overlay$ | |
Counts Items from another Overlay with origins inside a 'coverage' of Polygons, with additional classification, each Item only being counted once.
For example, starting with an Overlay containing a coverage of LSOAs, and another Overlay of locations of incidents of various types, assign each theft to the first containing LSOA (using the input order, so the Sort Process operation can be used first to control this), and count each type. It is typically the case that the input Polygons do not Overlap.
The result is a JSON property of types and counts, on a copy of each LSOA that has any matching incidents.
| Property | Description | Value | |
| Expression* | The 'classification' of each Item, as a simple property name, or as an expression, eg 'IncidentType$' or 'Iif(Speed#>SpeedLimit#,"Speeding","Not speeding")' | _expression@ | |
|
Filter Expression* |
A filter expression, eg '_FC& IN (1,2,3)' or 'IncidentType$ IN ("RTC","RRO")', to use when looking for Items | _filter$ | |
|
Overlay |
The name of the Overlay containing the Items to count and classify | _overlay$ | |
Counts Items from another Overlay with origins inside a Polygon, with additional classification, each Item being counted in any containing Polygon
For example, starting with an Overlay containing overlapping Isochrone Polygons from station locations, and another Overlay of locations of incidents of various types, assign each theft to the all containing Isochrone Polygons, and count each type.
The result is a JSON property of types and counts, on a copy of each buffer Polygon that has any matching incidents.
Properties are the same as Count and classify (within Polygon coverage).
| Property | Description | Value | |
| Expression* | The 'classification' of each Item, as a simple property name, or as an expression, eg 'IncidentType$' or 'Iif(Speed#>SpeedLimit#,"Speeding","Not speeding")' | _expression@ | |
|
Filter Expression* |
A filter expression, eg '_FC& IN (1,2,3)' or 'IncidentType$ IN ("RTC","RRO")', to use when looking for Items | _filter$ | |
|
Overlay |
The name of the Overlay containing the Items to count and classify | _overlay$ | |
Creates Thiessen Polygons of influence around the hook point of Items.
| Property | Value | |
|
High X |
The high X (right) value of the extents box of the Thiessen Polygons as a simple value or as an expression. | |
|
High Y |
The high Y (top) value of the extents box of the Thiessen Polygons as a simple value or as an expression. | |
|
Low X |
The low X (left) value of the extents box of the Thiessen Polygons as a simple value or as an expression. | |
|
Low Y |
The low Y (bottom) value of the extents box of the Thiessen Polygons, as a simple value, or as an expression. | |
|
Margin |
The margin by which the extents should be padded, as a simple value, or as an expression. | |
See Spatial Analysis-Thiessen Polygons and the Thiessen Polygons command for an example of creating a Thiessen Polygon.
New process available in upcoming Service Release
Creates a Point at the 'spatial mean' of the origin of Items.
New process available in upcoming Service Release
Creates a Point at the ‘weighted spatial mean’ of the origin of Items, adjusted for the ‘weighting’ of each Item
Merges Items based on attribute values.
Expression*: The merge value, as a simple property name, or as an expression.
Example: _area#>1000
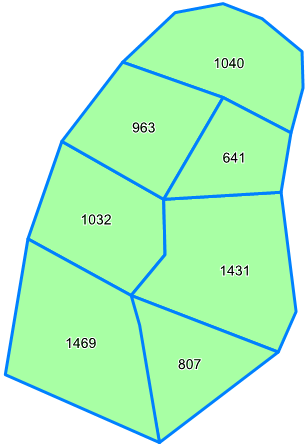
The initial map with areas shown by a Labels theme:
All the selected items that match the Expression*_area#>1000, are merged together (Boolean Union) into a single item:
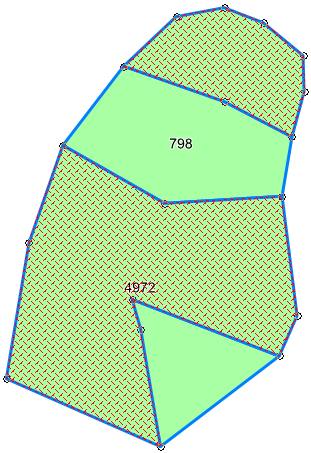
The rest of the selected items are merged into another single item:
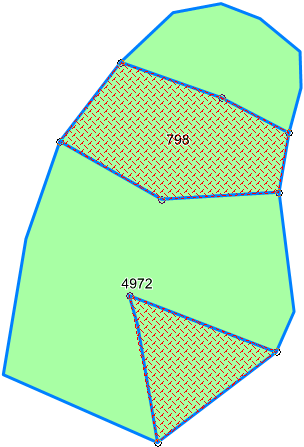
See also Dissolve command.
Creates a 'geodetic' buffer around an Item i.e. a buffer that takes the curvature of the Earth into account.
| Property | Value | |
|
Distance* |
The geodetic buffer radius in metres as a simple value or as an expression, eg '12.34' or Max(123.4,Sqrt(_area#))'. | |
|
Number of points |
The number of points to use when calculating the buffer as a simple value or as an expression, eg '64' or 'Max(64,Int(Floor(0.5*(_sx#+sy#))))' ( the default value is 4. | |
Calculates the Getis-Ord Gi* statistic for each feature in a dataset.
| Property | Value | |
| Distance | This is the threshold distance when performing a search for polygons in the local neighbourhood; any polygons with centroids outside this distance will be ignored when calculating the local average value.This option is only used when the Relationship (see below) parameter is set to Inverse distance, Inverse distance squared, Fixed distance band or Zone of indifference. If no other centroids can be found within this distance, the Z and P values for the polygon will not be set and a further column will be created in the schema holding an error value. |
|
| Distance method* | Select the required distance measure: Euclidian: As the crow flies, ie a straight line. Manhattan: Imitates moving across a city block: distances are traversed at right angles i.e. the sum of the difference between the two point coordinates. |
|
| Expression | Analysis variable to calculate Gi* statistics on eg CrimesTotal#. The input value for analysis, as a simple property name, or as an expression, eg 'IncidentCount&' or 'NumIncidentsJan& + NumIncidentsFeb&'. The expression must be appended with the # / & /$ symbol. | |
| Number of neighbours | The number of neighbours to factor in to the local average calculations when using the K Nearest Neighbours Spatial Relationship parameter – will search for that many of the nearest centroids to the centroid of the polygon being calculated upon. | |
|
Relationship* |
Conceptulization of spatial relationship. Inverse distance: The weighting for features will decrease regularly with distance from the original centroid up to the distance threshold Inverse distance squaredSame as Inverse Distance, however the weighting will decrease more severely with distance. Fixed distance bandEvery polygon within the distance threshold is counted as being ‘in’ and weighted 1, everything outside is counted as ‘out’ and weighted 0. Zone of indifference: Combination of Fixed Distance band and Inverse Distance. Everything inside the threshold is ‘in’ and weighted 1, after this point the weighting tapers off towards 0. K Nearest Neighbour: Will search for the K nearest centroids to the polygons centroid and use these as the Local Neighbourhood with weightings of 1, any others will be ignored (weighted 0). |
|
Combines the Items using the intersect boolean operation, i.e. only overlaps are kept. No input values required.
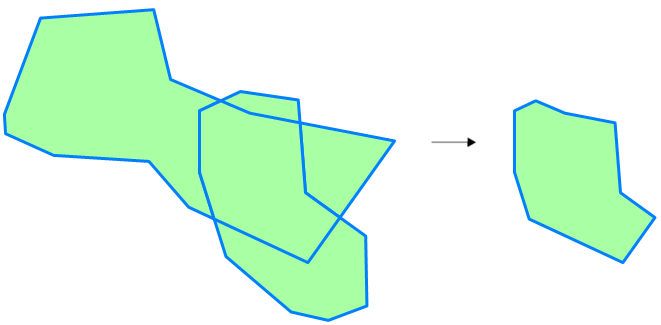
See also Intersect command.
Sets a 'location quotient' property on Items, the ratio of the share of a regional value relative to the share of a reference value, eg crimes by population size
For example, for an Overlay containing LSOA Polygons with one property containing the number of incidents, and another property containing the population, calculate the ratio of ratios of the two, such that an LSAO that has 1/4 (25%) of the number of incidents, but 1/8 (12.5%) of the population, will have a location quotient of 2 (1/4 divided by 1/8). Outputs into the Schema table:
| Property | Description | Value | |
| Reference' value* | The 'reference' value for the Item, as an expression, eg 'Population&' (the share of the total will be used as the denominator) | _reference@ | |
|
Regional' value |
The 'regional' value for the Item, as an expression, eg 'NumberOfCrimes&' (the share of the total will be used as the numerator) | _regional@ | |
New process available in upcoming Service Release
Calculates the 'Global Moran's I' spatial autocorrelation statistic (a measure of clustering) from the origins of a set of Items.
Used to measure spatial autocorrelation, it helps determine if patterns in a dataset are clustered, dispersed, or random. Outputs a index ranging from -1 to +1: positive value indicates clustering, negative value indicates dispersion, value near zero indicates randomness.
| Property | Description | Value | |
| Distance | Distance band or threshold distance | _bandwidth@ | |
|
Distance Method |
Content will be added | _distance@ | |
|
Expression |
The input value for analysis, as a simple property name, or as an expression, eg 'IncidentCount&' or 'NumIncidentsJan& + NumIncidentsFeb&' | _expression@ | |
|
Number of neighbours |
Content will be added | _k@ | |
|
Relationship |
Conceptualization of spatial relationship | _src@ | |
New process available in upcoming Service Release
Calculates the 'Global Moran's I' spatial autocorrelation statistic (a measure of clustering) from the origins of Items on another Overlay.
New process available in upcoming Service Release
Calculates the 'Local Moran's I' spatial autocorrelation statistics (identifying clusters and outliers) from the origins of a set of Items.
New process available in upcoming Service Release
Calculates the 'Nearest Neighbour Index' from the origins of a set of Items.
The Nearest Neighbour Index (NNI) is the ratio of the ‘observed’ mean distance between features, against the ‘expected’ mean distance. The ‘expected’ mean distance is that of a ‘perfect’ random distribution, and is calculated from the ‘study area’.
For an Overlay of incidents, the distances between each pair of origins are calculated and averaged, and the ‘study area’ is a slightly padded version of the bounding box of the origins. The output is the ‘study area’ Polygon, with NNI-related properties.
An NNI property value (NearestNeighbourIndex::Ratio#) of less than one indicates clustering, and an index of greater than one indicates dispersion.
New process available in upcoming Service Release
Calculates the 'Nearest Neighbour Index' from the origins of Items on another Overlay.
The NNI calculation is the same as that for Nearest neighbour index (from Items), except that the ‘study area’ is that of the containing Polygon, and the Items being used for the calculation come from another Overlay.
For example, starting with an Overlay containing a coverage of LSOAs, and another Overlay of locations of incidents, the NNI for each LSOA can be calculated and compared.
The output is a copy of the input ‘study area’ Polygon, with NNI-related properties.
| Property | Description | Value | |
|
Overlay |
The name of the Overlay containing the Items. | _overlay$ | |
| Filter Expression | A filter expression, eg '_FC& IN (1,2,3)' or 'IncidentType$ IN ("Theft","Burglary")', to use when looking for Items | _filter$ | |
Overlay append.
Attribute Prefix
TBD
Overlay Attribute Prefix
TBD
Overlay*
The overlay with which to perform the operation. A drop-down allows you to select the required overlay:
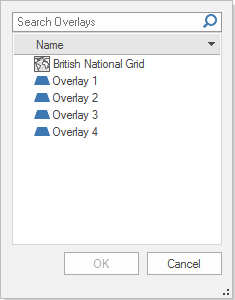
Select the overlay and click OK.
Overlay clip.
Attribute Prefix
TBD
Overlay Attribute Prefix
TBD
Overlay*
The overlay with which to perform the operation.
A drop-down allows you to select the required overlay:

Select the overlay and click OK.
Overlay erase.
Properties
Attribute Prefix
TBD
Overlay Attribute Prefix
TBD
Overlay*
The overlay with which to perform the operation.
A drop-down allows you to select the required overlay:

Select the overlay and click OK.
Overlay identity.
Attribute Prefix
TBD
Overlay Attribute Prefix
TBD
Overlay*
The overlay with which to perform the operation. A drop-down allows you to select the required overlay:

Select the overlay and click OK.
Overlay intersect.
Attribute Prefix
TBD
Overlay Attribute Prefix
TBD
Overlay*
The overlay with which to perform the operation.
A drop-down allows you to select the required overlay:

Select the overlay and click OK.
Overlay*
The overlay with which to perform the operation.
A drop-down allows you to select the required overlay:

Select the overlay and click OK.
Attribute Prefix
TBD
Overlay Attribute Prefix
TBD
Overlay*
The overlay with which to perform the operation.
A drop-down allows you to select the required overlay:

Select the overlay and click OK.
The overlay with which to perform the operation.
A drop-down allows you to select the required overlay:

Select the overlay and click OK.
Creates a QZone buffer around an Item.
| Property | Value | |
|
Cellsize* |
The QZone cell size, as a simple value, or as an expression. | |
|
Radius |
The buffer radius, as a simple value, or as an expression. | |
Original map:
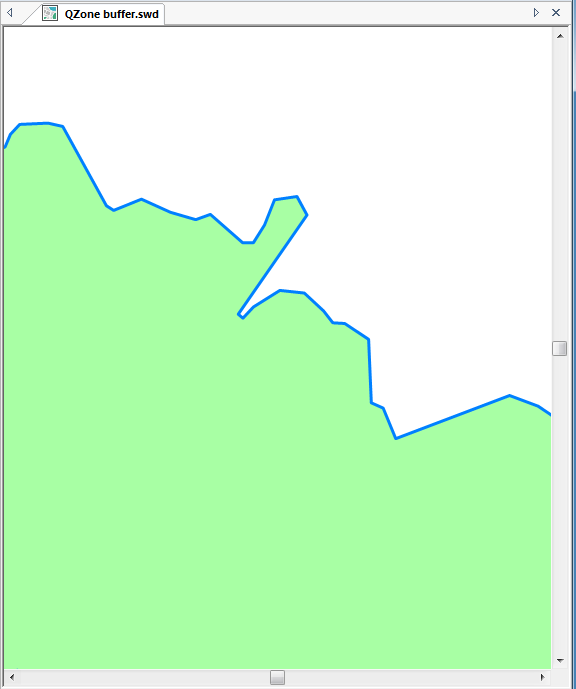
Typical display obtained using QZone buffer:
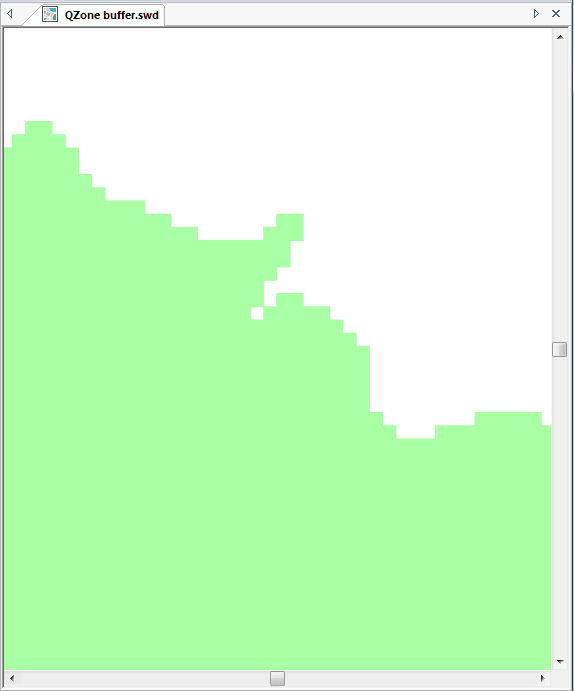
See also QZone command.
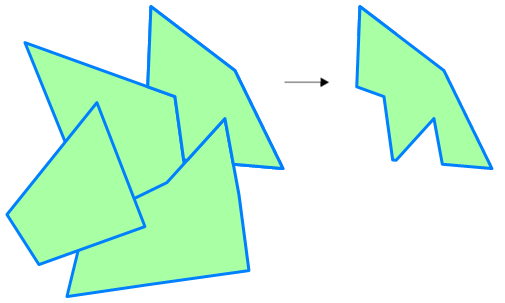
Combines the Items using the subtract boolean operation, ie any overlaps between the first Item and the second and subsequent Items are removed. No input values required.
The output would be as shown:
Combines the Items using the symmetric difference boolean operation, generating alternate geometries, i.e. any overlaps are removed. No input values required.
The area of overlap is deleted, and a MultiPolygon item is created as shown below:
If there are multiple areas of overlap, they are alternately deleted or left intact:
See also Symmetric Difference.
Combines the Items using the union operation, i.e. all parts of both Items are kept.

See Union command
Creates 'Viewshed' Grids from the Item origin over source Grid Items from another Overlay.
| Property | Value | |
| Filter Expression | A filter expression, e.g. '_FC& IN (1,2,3)' or 'grid_type$="DEM", to use when finding the source Grid Items. | |
| Overlay* | The name of the Overlay containing the source Grid Items. | |
| Radius* | The 'Viewshed' radius, as a simple value, or as an expression, e.g. '12.34' or 'Max(123.4,broadcast_range#)' | |
Creates a'Viewshed' QZone from the Item origin over source Grid Items from another Overlay.
| Property | Value | |
| Filter Expression |
A filter expression, e.g. '_FC& IN (1,2,3)' or 'grid_type$="DEM", to use when finding the source Grid Items. |
|
| Overlay* | The name of the Overlay containing the source Grid Items. | |
| Radius* | The 'Viewshed' radius, as a simple value, or as an expression, e.g. '12.34' or 'Max(123.4,broadcast_range#)' | |
Creates 'Viewshed' Grids from the Item origin over source Grid Items from another Overlay, containing only the cell values 1 (in Viewshed) and 0 (not in Viewshed).
| Property | Value | |
| Filter Expression | A filter expression, e.g. '_FC& IN (1,2,3)' or 'grid_type$="DEM", to use when finding the source Grid Items. | |
| Overlay* | The name of the Overlay containing the source Grid Items. | |
| Radius* | The 'Viewshed' radius, as a simple value, or as an expression, e.g. '12.34' or 'Max(123.4,broadcast_range#)' | |