SIS uses the concept of scale in the following areas, each of which can have an effect on the way your spatial data (graphics), text and symbology are displayed.
The Display Scale is shown in the Status Bar at the bottom of the SIS main window and changes as you zoom in or out.
All data in SIS is stored in 'real world' sizes within a coordinate system. When the data are displayed on screen, the real world sizes are shrunk to fit the computer monitor.
Because screen sizes differ the Display Scale shown is only an approximation. For example if you project a SIS map onto a large wall-mounted screen the Display Scale will be different to the Display Scale on a monitor.
There are a number of ways of selecting and adjusting the Display Scale:
.gif) and type the value into the Zoom to Scale dialog:
and type the value into the Zoom to Scale dialog:
Scale
The new view scale.
Centre of view
The new centre of the view, enter as required.
You will have seen that, when zoomed in closely on some datasets, all graphics are visible. As you zoom out, smaller details progressively disappear. This is designed to speed up the display of very complex maps.
For example, if you are examining OS MasterMap data, when zoomed out SIS might display only road centrelines, water features, railways and administrative boundaries. Zooming in could show building outlines, water features, pecked road metalling, etc. (but road centrelines are no longer displayed). Zooming in further will reveal road names, house numbers and other smaller details.
SIS uses real numbers for scale thresholds, typical of mapping scales, throughout. However, you can also input any scale value you want. Previous versions of SIS used scale thresholds based upon a logarithmic scale.
Each map overlay displayed in a map window has minimum and maximum settings, and the overlay is displayed on the screen only when the display scale is between these two settings.
The display scale at which certain data is filtered out is controlled by default settings. However, you can override these settings, either for an entire overlay or for different features in the dataset.
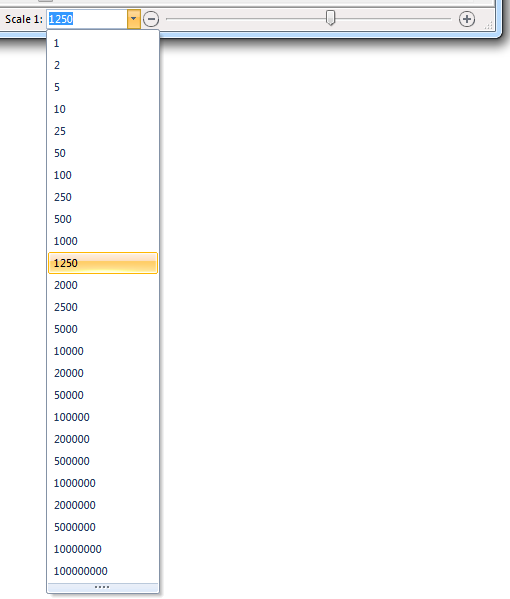
Go to the General tab. In the Scale Thresholds area of the tab the minimum and maximum scale thresholds can be selected from the drop-down lists or you can enter your own values:
The Minimum value indicates the lowest number (the largest scale) at which graphics should appear, while the Maximum value indicates the highest number (the smallest scale) at which graphics will be displayed. To return the values to (default) click on the
button.
When you set such an override, all data on the overlay is displayed or not displayed according to the values you entered. This means that different display scales are no longer applied to the different features such as Road Centrelines, Building Outlines, etc.
By setting different display scale thresholds for different overlays, you can build window definitions (SWD files) in which the degree of detail or type of information displayed changes as you zoom in or out.
For example, if you had overlaid architectural plans of certain buildings (in a DXF file) onto your map base. By setting a Maximum scale of 200 on the DXF overlay, you would ensure that this detail would be displayed only when the view was zoomed in to a display scale larger than 1:200. As you zoomed out to a scale smaller than 1:200, the DXF architectural data would no longer appear and the map base would not be cluttered by detail which is too fine to be of use.
Use this process to set the display scale of individual feature types. An example might be setting the display scale of Road Centre Lines so that they are shown at all scales.
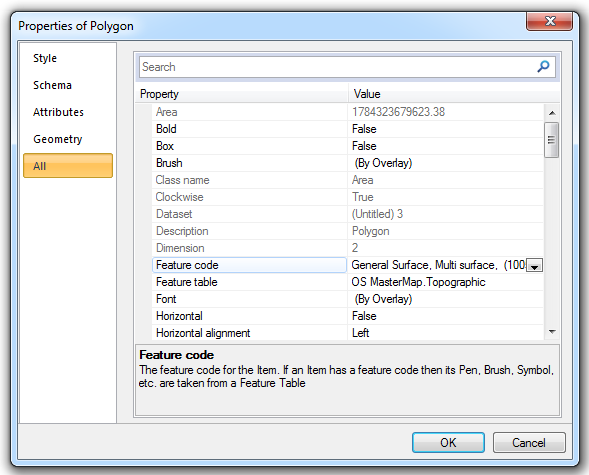
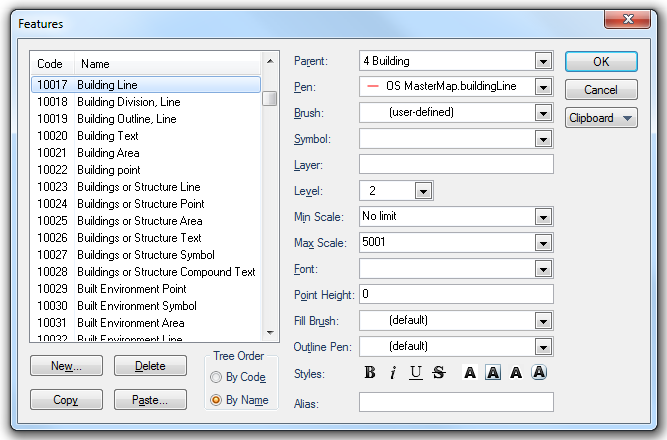
The changes made to the properties of this feature code are stored in the current library.
From now on you can edit the feature code again by selecting it by double-clicking it in the Libraries Control Bar.
The Minimum scale is the scale below which the data will not be displayed. The Maximum scale is the scale above which the data will not be displayed. The data to which these scales apply is visible only when the display scale is between these two numbers.
For instance, if you had a Minimum scale of 1000 set for Buildings, and a Maximum scale of 5000, Buildings would be displayed as long as the display scale (as shown on the Status Bar) indicated a number between 1000 and 5000.
When setting the Minimum scale and Maximum scale, you select a value from the drop-down list. Possible scales are within the range 1 to 100 000 000. To save storage space, these scales are stored as logarithmic values between 0 and 255. It is not possible to specify certain scale numbers precisely in numbers we normally use. For example, the nearest scale to 1250 is 1276. As this is solely the screen magnification scale, and has no bearing on the actual scale at which data is printed, these approximations are not important.
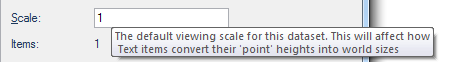
Items which do not have real world sizes on the map (cartographic artefacts such as text, Symbols, LineString thicknesses and hatching patterns) need to be scaled differently from real world items (roads, buildings, etc.). To deal with this, each dataset has a Dataset Scale.
Point text does not exist as a geographical feature, it is simply stored as a position. The height of the text might be set to 12 points (approximately 1/6th inch or 4mm high). Imagine viewing the North American continent with the state names printed in 12 point text! It would take a spy satellite to read the names, or you would have to zoom in very, very closely!
By setting the Dataset Scale to an appropriate value, Text, Symbols, LineString thicknesses and hatching patterns will be displayed appropriate to that scale. A map of the states of the USA would need a Dataset Scale of about 1:20,000,000 for the 12 point state names to appear at a reasonable size. In other words, display 4mm text at a height of 4mm x 20,000,000 = 80Km high!
To change the Dataset Scale select Overlays [Home-Map], click on the Dataset tab and enter the required scale in the Scale box. However, if the dataset is read only this will not be possible. For this reason SIS provides you with the ability to override the Dataset Scale with an Overlay Scale (see below).
The Dataset Scale can also be changed by right-clicking on the overlay in the Maps Control Bar, selecting Dataset > Properties and entering the required dataset scale in the displayed dialog.
Different datasets in an SWD can have different scales, therefore you could overlay maps at a scale of 1:1250 with maps at 1:10 000. Some external file-based datasets know their dataset scales (e.g. Ordnance Survey MasterMap Topography layer is automatically set to a scale of 1:1250).
When you create a base dataset file or an internal dataset, they take their Dataset Scale from the first overlay that has been opened. If the first overlay is, for example, the British National Grid backdrop, which has a scale of 1:10000000, the scale of your new dataset will also be 1:10000000. If there are no overlays open (i.e. it is a new SWD), the Dataset Scale will be set to 1. If you wish to alter the Dataset Scale, you can do this in the Overlay dialog, Dataset tab.
The scale of any dataset can be overridden using the following method:
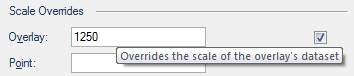
The Overlay Scale can be set to override the intrinsic scale of the overlay's dataset. Only SIS datasets store a scale. If your data has been produced in another GIS system, you may need to set the Overlay Scale to override the dataset scale, which will be 1:1.
Alternatively, you may be viewing a SIS dataset which was intended for use at a small scale but you want to use it within a set of overlays at a much larger scale.
Select Overlays [Home-Map] and click on the Styles tab. Here you can check the Scale Overrides tickbox and enter the required scale for the overlay:
When you click the Apply button you will see the effect of changing the scale representation of text, symbols, LineString thicknesses and hatching patterns. The result is identical to changing the Dataset Scale, but the override only applies to the dataset as it is represented in your current SWD.
Send comments on this topic.
Click to return to www.cadcorp.com
© Copyright 2000-2017 Computer Aided Development Corporation Limited (Cadcorp).