Creating a Schema
1. Select Home > Overlays > Schema.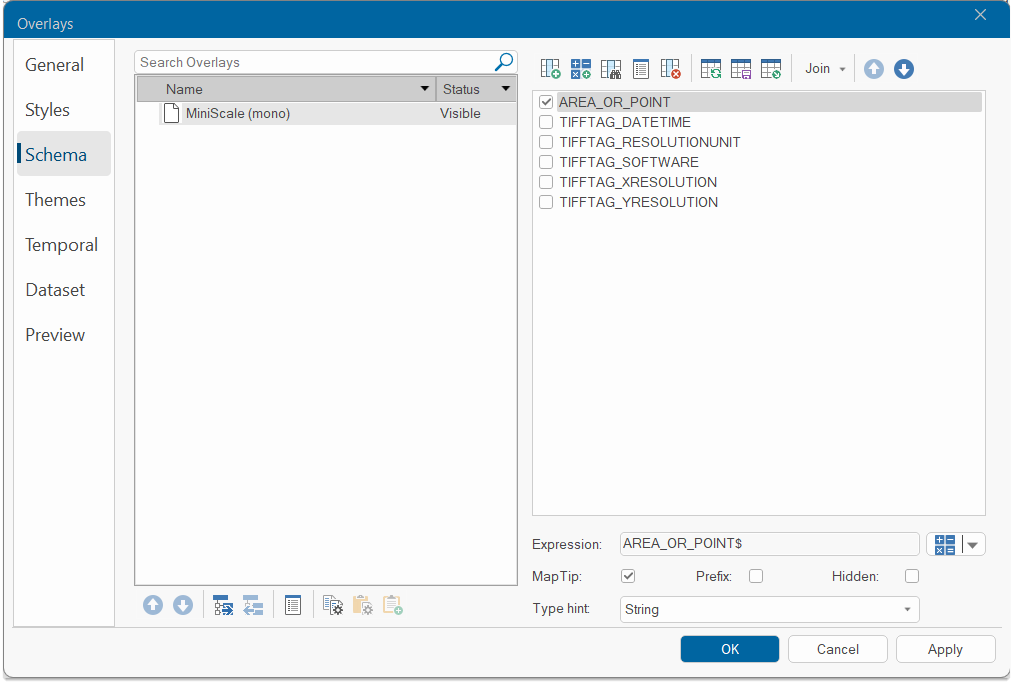
2. Select the desired overlay; the overlay’s properties are displayed in the right pane. This list varies according to the type of dataset.
3. After selection, you will notice the Map Tip box at the bottom being automatically enabled.
| Columns |
| Change Column Order |
| Notes |
Columns
Use these options to add, customise or remove various columns.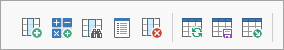
1. Add Property
Column 
Add any existing Built-in Property or user-defined Property/Attribute. For more information on each property, see here.
To add a new user attribute, check the New user attribute radio button, enter the attribute name and select the type from the Type drop-down box.
2. Add Expression Column

Add an expression to the column that can “filter” attributes. You can set filters to show only attributes with specific values or a range of values in the schema. (eg this could be a range of areas, a date range or a specific date).
Type an expression in the top pane of the Expression Builder dialog. Use the Expression Categories and Expression Values panes to identify and select the operations and values: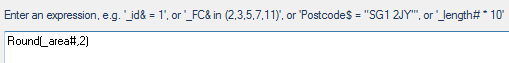
The above example gets the Area value of items, rounded to two decimal places.
3. Add Spatial Expression
Column 
Use this wizard to include a spatial expression-based schema column to an overlay.
4. Properties

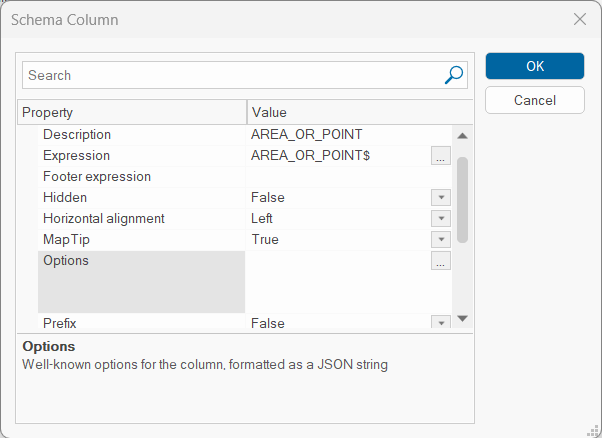
Click to display and edit properties of the Schema column.
5. Delete 
Deletes a column from the schema overlay. Deleting a column here does not remove any actual data.
Highlight the column in the right-hand pane and select Delete.
6. Reset Columns

Use to reset all schema columns to their default settings. The default columns are dependent on the dataset of the overlay.
7. Save 
Schemas are named objects and saved in libraries. Click Save and enter a name and folder.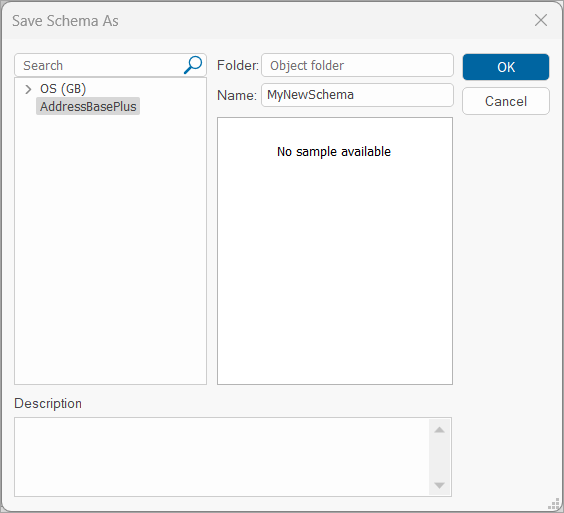
You can see the saved schema as a NOL in Libraries.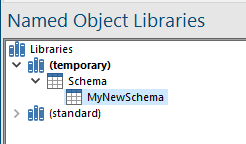
8. Load 
To recall a schema click Load and select the required schema from the list..
Note: Schemas used by Oracle, PostGIS and other cursor datasets do not allow the schema to be altered on the Overlays dialog. You must edit them directly inside the database or use the Dataset/Properties local command (on the spatial database overlay’s local menu).
9. Join
Join sets a join between an overlay and a table.
9a.Connect
The join between an overlay and a table is setup in the SWD and is available in SIS Desktop and GeognoSIS. Select from one of the available Database Types and follow the relevant wizard to complete the connection. See also Linking Data to an Overlay topic for details on linking overlay tables.
Note: An overlay table join does not require the data source to be added as a Named Table.
9b. Refresh
Refreshes the cached data.
9c. Properties
This option takes you to the last screen of the connection wizard as above.
|
Option |
Description |
|
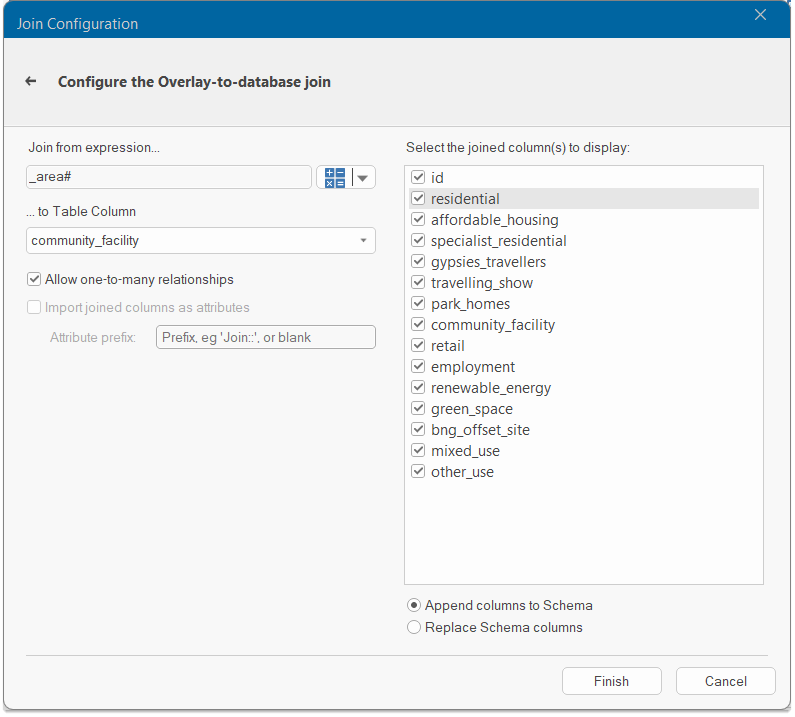
| Join from expression... / ...to Table Column | Field values from the linked data source are derived through the Join expression where the “Join from expression... / ...to Table Column” configuration is met | |
| Allow one-to-many relationships | Enable to allow one-to-many type relationships. | |
| Select the joined column(s) to display | Uncheck any of the tickboxes for the joined columns not to be displayed. | |
| Append columns to Schema | Enable to append the Named Table columns to the existing overlay schema. | |
| Replace Schema columns | Enable to replace the existing overlay schema. | |
| Disconnect | Disconnects from the database. | |
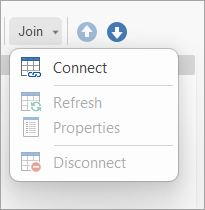
The Refresh, Properties and Disconnect options are only enabled for overlays with an active Table Join: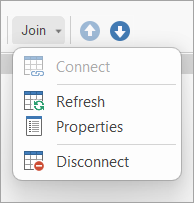
![]()
Change Column Order
To change the order of the column items, click on the item and use the up and down arrows to move it in the list.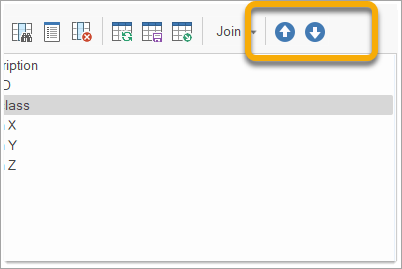
![]()
Notes
- Use the
 button to pick a new property or edit the expression you have created earlier.
 - To change a column description, select the item in the Columns list and click twice (not double-click). Simply type in the new name. Alternatively select the item and press F2.
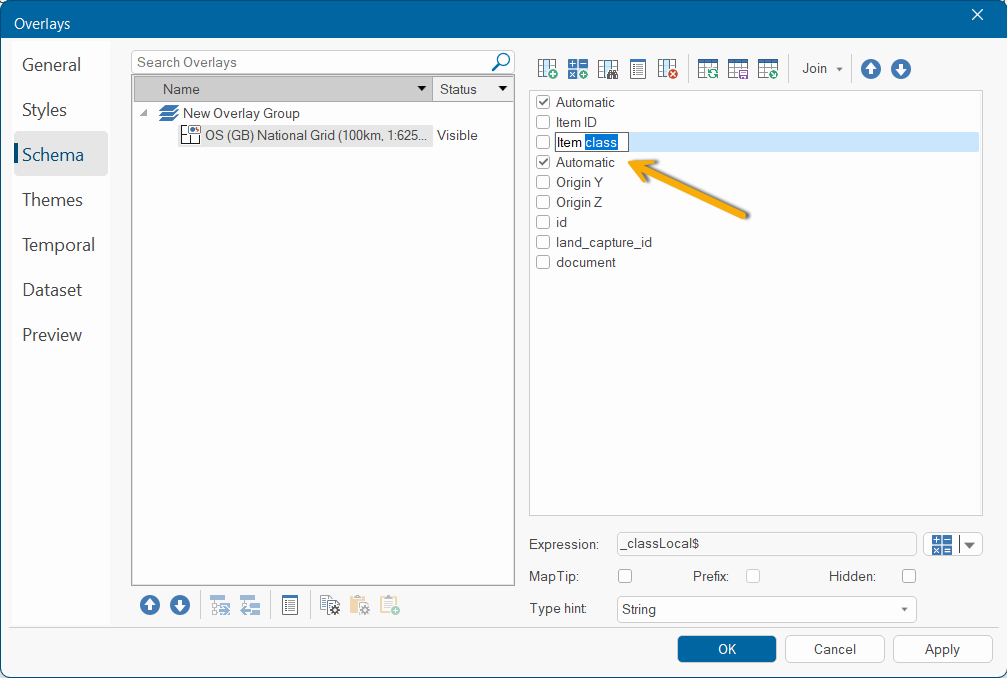
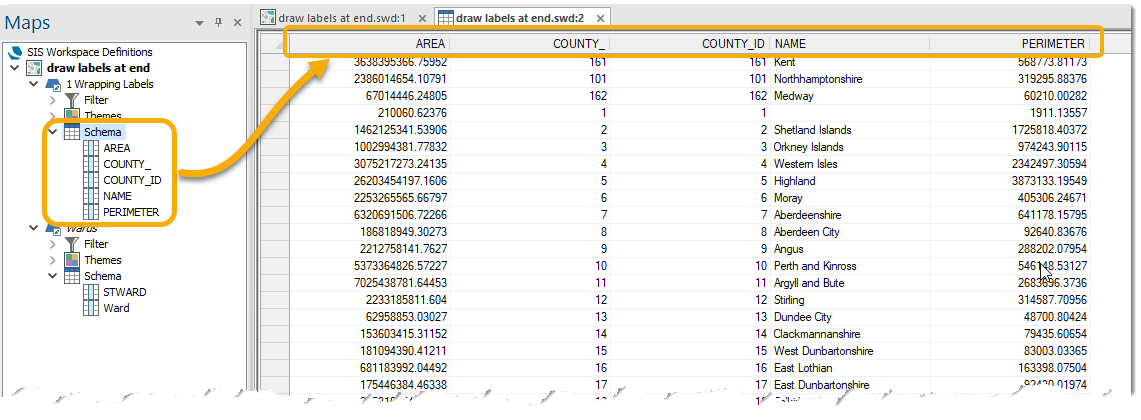
- The contents of this description field are used for the heading of the column in the Table Window.
- Check the Map Tip tickbox to display related information when the cursor is near an item in a Map Window.
 Related Topics
 - The Type hint allows the same attribute name to be used for different data types.
For example dataset which has attribute "abcd@" could be a "string" type and another dataset also with attribute "abcd@" could be set to "date" type . - The Type hint drop-down box offers these following options:
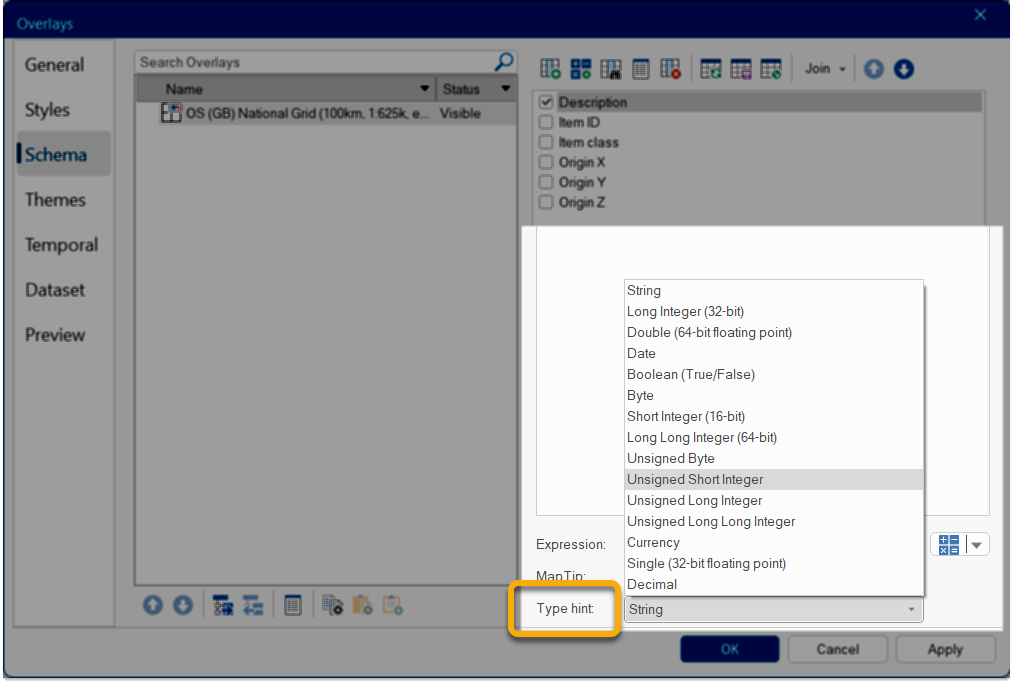
| Type | Values |
|
String |
Text |
|
Long Integer (32-bit) |
-2147483648 to 2147483647 |
|
Double (64-bit floating point |
-1.7976931348623158e+308 to +1.7976931348623158e+308, |
|
Date |
1 January 100 - 31 December 9999 (Gregorian calendar only |
|
Boolean (True/False) |
0 False, or -1 True (any non-zero will be interpreted as true) |
|
Byte |
-128 to 127 |
|
Short Integer (16-bit) |
-32768 to 32767 |
|
Long Long Integer (64-bit) |
-9223372036854775808 to 9223372036854775807 |
|
Unsigned Byte |
0 to 255 (0xff) |
|
Unsigned Short Integer |
0 to 65535 (0xffff) |
|
Unsigned Long Integer |
0 to 4294967295 (0xffffffff) |
|
Unsigned Long Long Integer |
0 to 18446744073709551615 (0xffffffffffffffff) |
|
Currency |
-922337203685477.5808 to 922337203685477.5807 |
|
Single (32-bit floating point) |
-3.402823466e+38F to +3.402823466e+38F, |
|
Decimal |
Holds signed 128-bit (16-byte) values representing 96-bit (12-byte) integer numbers scaled by a power factor of 10. The power factor is a property of the storage method and is invisible to the user. The Decimal property is only relevant to cursor-datasets. Note: It is recommended one of the floating point properties is used in preference to the Decimal property. |
![]()