 Benchmark Benchmark
 Benchmark benchmarks the drawing speed in the current window.
Example:
Load an SWD, in this example, HaylingIsland SWD:
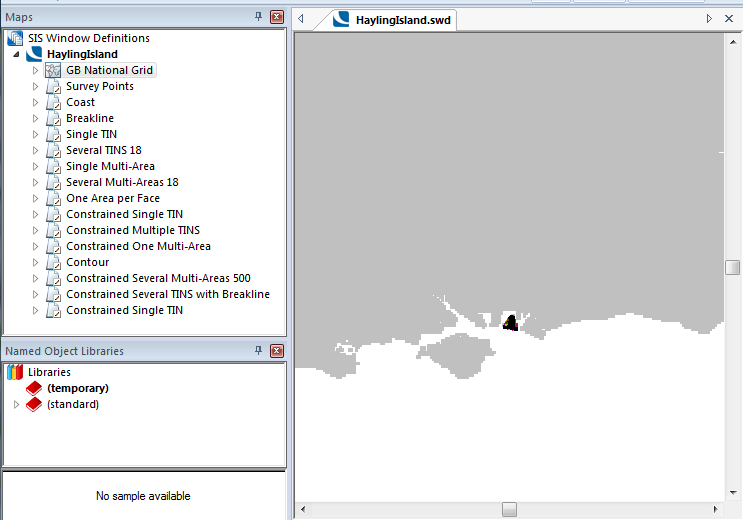
Select Benchmark.
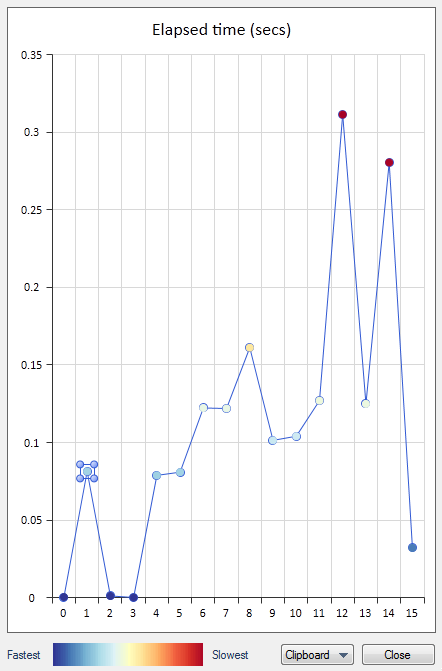
The SWD drawing time (secs): dialog will be displayed:
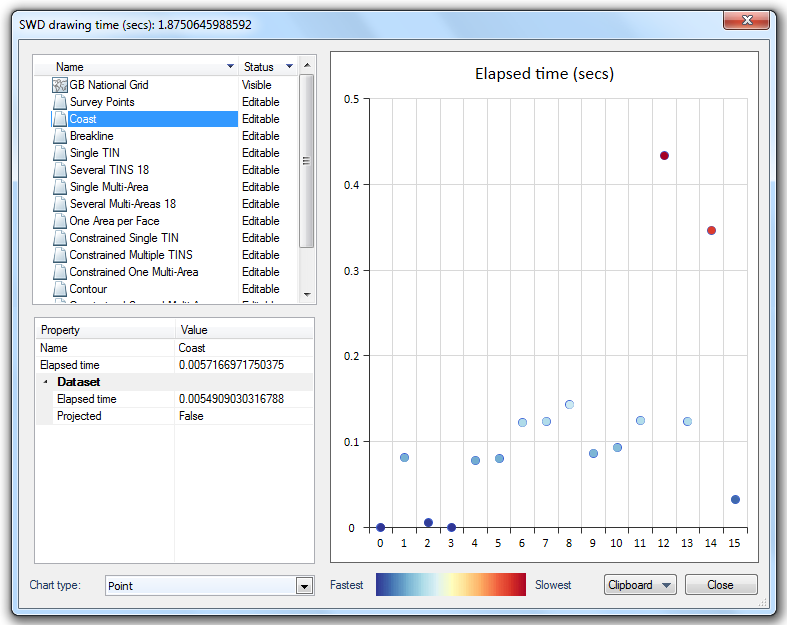
The chart will show the elapsed time to draw each overlay within the SWD.
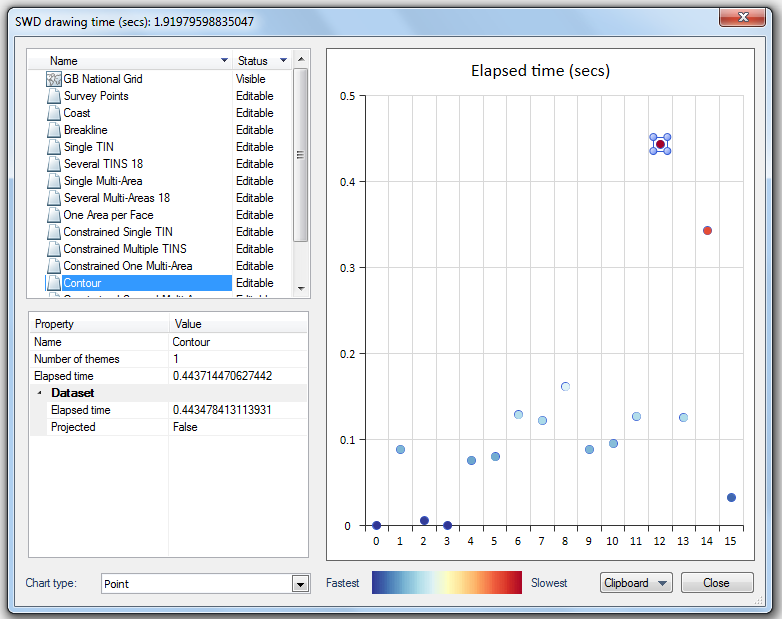
As you select each overlay in the left-hand pane the point for that overlay will be highlighted.
For example Contour overlay shows an elapsed drawing time of 0.311324 secs:
Properties and their values are also shown for each overlay in the SWD, these will vary between overlays but typically they could be:
Name (Overlay name)
Minimum scale - if other than default
Maximum scale - if other than default
Number of themes
Basemap (True/False)
Sprites (True/False)
Elapsed time - The time to load the Overlay.
Dataset > Description
Dataset > CRS
Dataset > EPSG Code
Dataset > Elapsed time - The time to load the dataset. An Overlay could have multiple datasets, e.g. Index Dataset tiles, each of which will have its own elapsed time.
Dataset > Projected (True/False) - True means the dataset is being reprojected. False means the dataset is not being reprojected and is in the native projection.
The Chart type drop-down allows you to select how you wish the chart to be displayed:
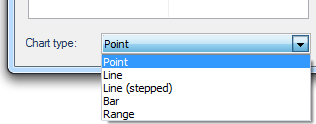
The options are:
Point (shown above)
Line:
Line (stepped):
 chart example.png)
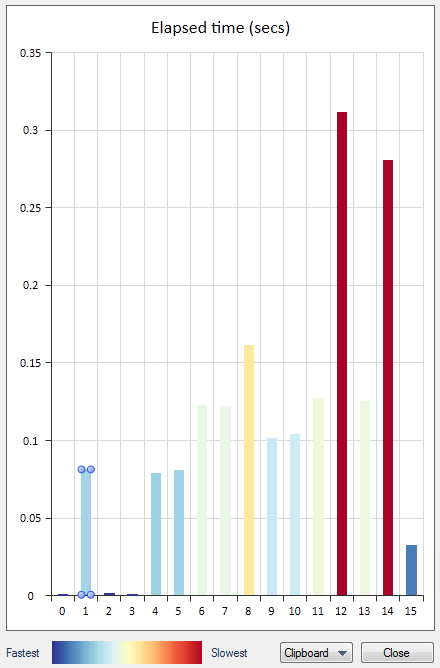
Bar:
Range:
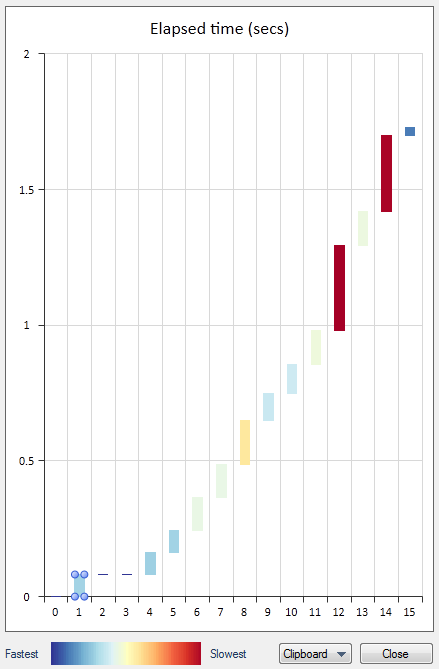
Clicking on a point, or bar, in the above chart types will highlight the corresponding overlay in the left-hand Name/Status pane.
The Fastest/Slow colour band indicates which overlays were relatively fast or slow:
In each of the above charts the overlays shown in dark blue are the fastest to load and the overlays shown in red are the slowest.
The Clipboard drop-down allows you to copy the chart or the data.
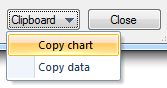
The Copy chart option allows the displayed chart to be copied. The chart can then be pasted into an editing or processing application, for example; PhotoShop or Microsoft Word.
The Copy data option allows the SWD data to be copied and, if required, pasted into a JSON editor for further analysis.
Top of page
Send comments on this topic.
Click to return to www.cadcorp.com
© Copyright 2000-2017 Computer Aided Development Corporation Limited (Cadcorp).