Bar Charts Bar Charts
Location: Theme Types dialog > Annotation tab > Bar Charts
Availability: Map Modeller, Map Editor, Map Manager, Map Express
The Bar Charts theme is used to compare the values of several properties. The height of the bar chart blocks are proportional to the value of a chosen property or expression.
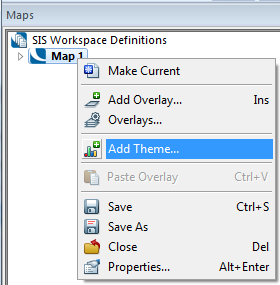
Click Add Theme [Home-Map] or highlight the SIS Workspace Definition (SWD) in the Maps Control Bar and select Add Theme...
If the SWD contains more than one overlay the Theme Overlay dialog will be displayed.
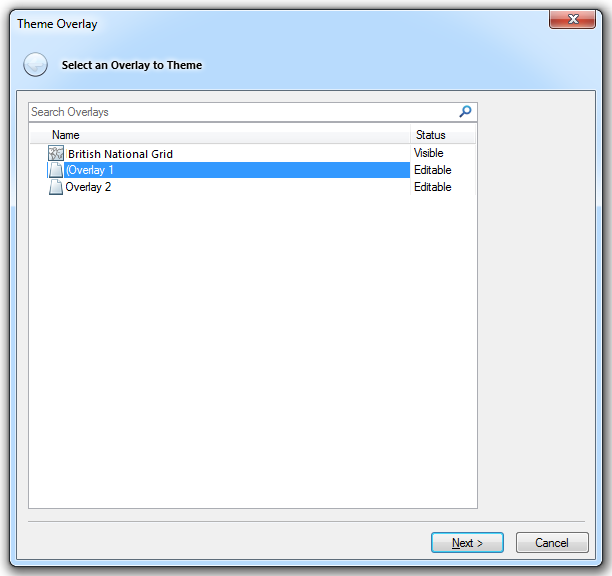
Either double-click the overlay to theme or select it and click Next.
The Theme Types dialog will now be displayed:
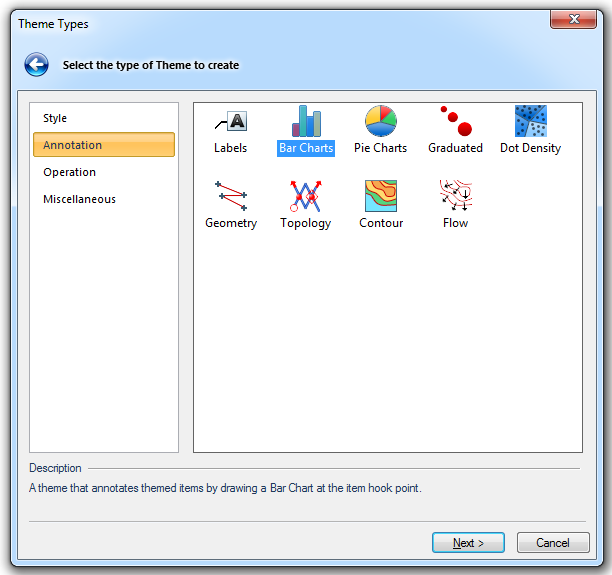
Go to the Annotation tab and either double click the Bar Charts icon or select it and click Next.
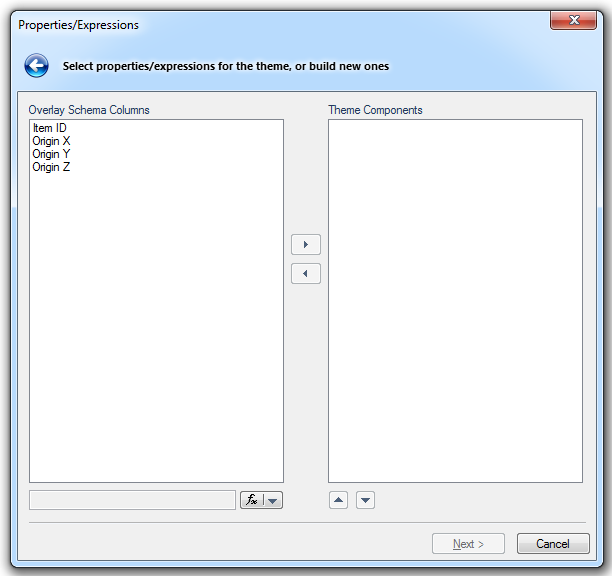
The Properties/Expressions dialog will be displayed:
The following example uses some Australian census data to compare the numbers of different ethnic groups in each state.
In the Select properties/expressions for the theme, or build new ones dialog, either:
 button to access the Expression Builder dialog if required). Click on the right chevrons to add this to the right-hand panel.
Click Next.
The following message will be displayed:
Click Yes.
The Bar Chart Styles dialog will be displayed:
Choose the parameters for the bar chart's appearance and placing:
Bar Chart settings
Alignment
Allows you to choose where the bar chart should be placed in relation to the item’s centre, or hook point.
The possible positions are:
Bottom Left
Bottom Centre
Bottom Right
Middle Left
Middle Centre
Middle Right
Top Left
Top Centre
Top Right
The default is Middle Centre:
Horizontal/Stacked
Check the Horizontal tickbox to align the blocks horizontally.
Check the Stacked tickbox to stack the bars either vertically or horizontally.
The following diagrams show the effect of the Horizontal and Stacked tickboxes:
Width (mm)
Enter a Width (mm) for the bars in millimetres (all bars use this same width).
Height (mm)
This is the height of a bar chart block when the value in the block is the at value (below). Valid values range from 0.01mm to 500mm, and are heights on screen or paper.
at value
This is the base value around which the block is scaled up or down. So if an item has this value, it will be represented by a block of the height shown in the Height field. If the value is less than this, the block will be shorter; if greater, the block will be taller. The means of scaling the block height is determined by the chosen graduated by setting.
graduated by
The values are:
- Square root - the block height is proportional to the square root of the ratio (this is the ratio of the evaluated block value to the at value).
- Linear - the block height is proportional to the ratio.
- Log (base-10) - the block height is proportional to the log (base 10) of the ratio when the value is greater than or equal to the value given in at value, and is proportional to the ratio when the value is less than the value given in at value.
Decimal places
This is the number of decimal places in the value, e.g. as shown in the legend.
Block styles
Properties/expressions
Title/Pen/Brush
Highlight each attribute name in the Properties/expressions panel and either accept the displayed Title, Pen and Brush settings for each attribute or change as required. The attribute tickboxes control whether the bar for the selected attribute will be displayed, i.e the button next to the attribute in the Maps Control Bar bar chart theme will be "on", unchecked tickboxes will cause the attribute to not be displayed, the button will be "off". These tickboxes have the same effect as selecting and de-selecting the button next to the attribute names in the Maps Control Bar.
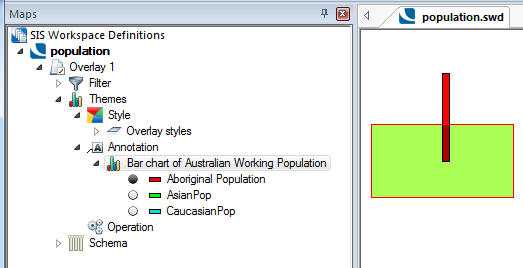
The following diagram shows the effect with all attribute tickboxes checked:
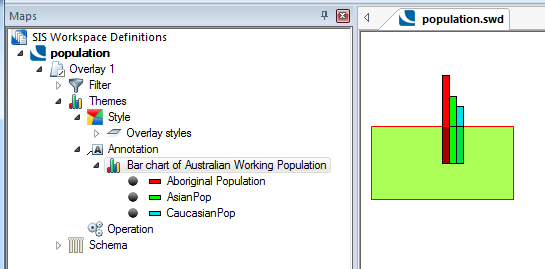
The following diagram shows the effect with only the AboriginalPop attribute tickbox checked:
Colours
Pens... Displays the Pick Colours dialog
Brushes... Displays the Pick Colours dialog

Click here for a description of the functions of these three buttons.
Click here for Bar Charts Theme properties.
Send comments on this topic.
Click to return to www.cadcorp.com
© Copyright 2000-2017 Computer Aided Development Corporation Limited (Cadcorp).