 Dot Density
 Dot Density
Location: Theme Types dialog > Annotation tab > Dot Density
Availability: Map Modeller, Map Editor, Map Manager.
The Dot Density theme annotates themed items by drawing a number of 'dots' inside the item, the number depending on the result of an expression.
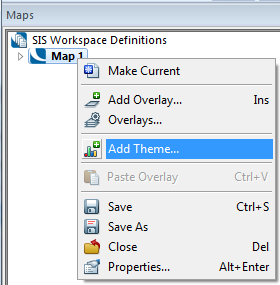
Click Add Theme [Home-Map] or highlight the SIS Workspace Definition (SWD) in the Maps Control Bar and select Add Theme...
If the SWD contains more than one overlay the following Theme Overlay dialog will be displayed:
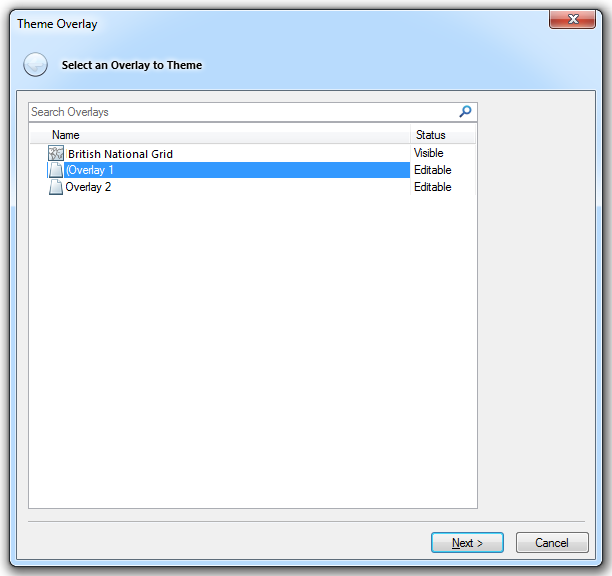
Either double-click the overlay to theme or select it and click Next.
The Theme Types dialog will now be displayed:
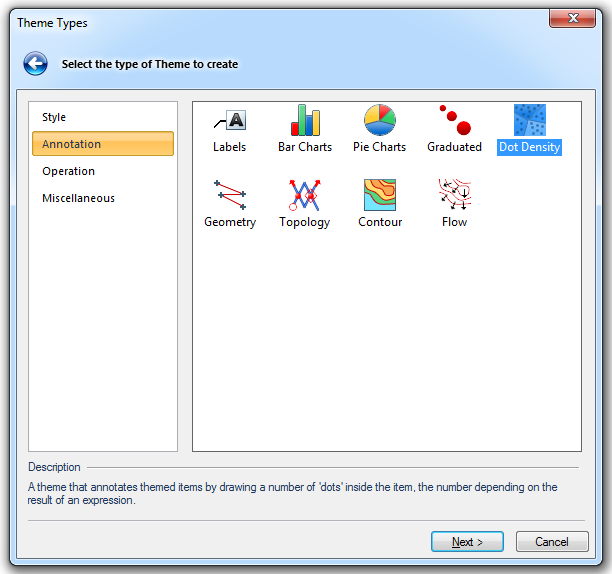
Go to the Annotation tab and either double click the Dot Density icon or select it and click Next.
The Property/Expression dialog will now be displayed.
If a schema column called Population has been added to the overlay and is now selected, the Property/Expression dialog will be:
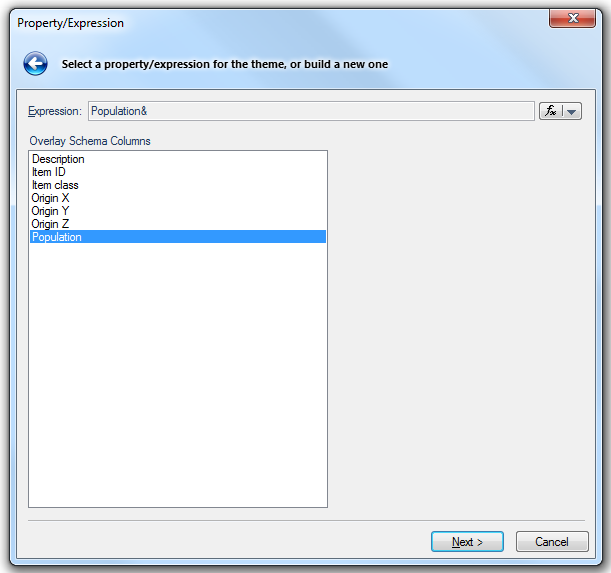
Click Next.
A dialog saying Do you want to search the Overlay for existing values? will be displayed.
Click Yes to proceed.
The Dot Density Styles dialog will be shown:
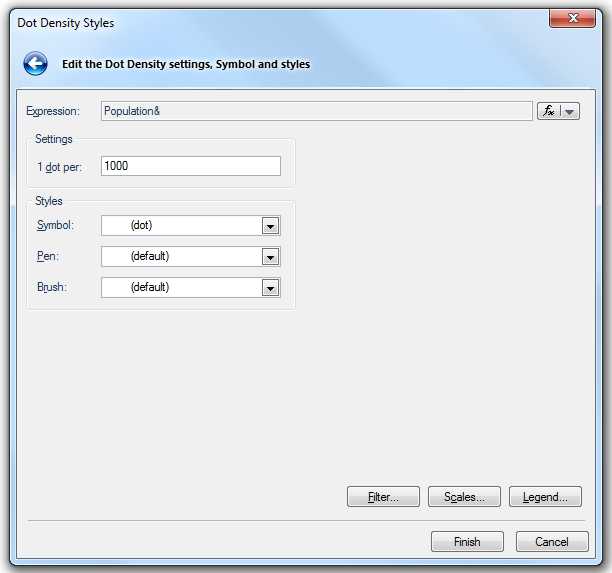
Click Finish.
The Dot Density theme is an example of choropleth mapping. This theme fills polygons with dots to show the value of a property or expression. The density of the dots in the different polygons gives an immediate visual indication of the spread of data.

Click here for a description of the functions of these three buttons.
Click here for Dot Density Theme properties.
Send comments on this topic.
Click to return to www.cadcorp.com
© Copyright 2000-2017 Computer Aided Development Corporation Limited (Cadcorp).