Scatter Grid
Scatter Grid uses a wizard to create a Grid item from several selected items. The Grid item will be large enough to just cover the origins of all of the selected items.
Select Analysis > Grids > Scatter Grid.
The items used to create the Grid are often Point items. The simplest way to make a Grid using Point items is to count them. This will result in each Grid cell storing a count of the number of Point items that were in that cell.
- You can choose the resolution of the Grid item (i.e. the size of the Grid cells) within the wizard.
- You can create either rectangular or square Grid cells; either way the cell size must be specified.
- The size of the cells is determined by the extent and type of the data being analysed. The larger the cell size (lower resolution) the more generalized the Scatter Grid.
- You can also choose how the selected items are used to determine the values of the Grid item's cells; either simply count the Point items or carry out other operations using a property or expression on each Point.
- The Grid will be created as an item and can be stored in an existing editable overlay or within a newly created Internal Overlay.
Sometimes you may have data stored as properties of Point items. Use Scatter Grid to convert this data to Grid format. For example if the Point items were drawn in 3D you could use the Origin Z property.
Example:
Select the items on which the grid is to be based and select Scatter Grid.
1. This opens the Grid Creation options.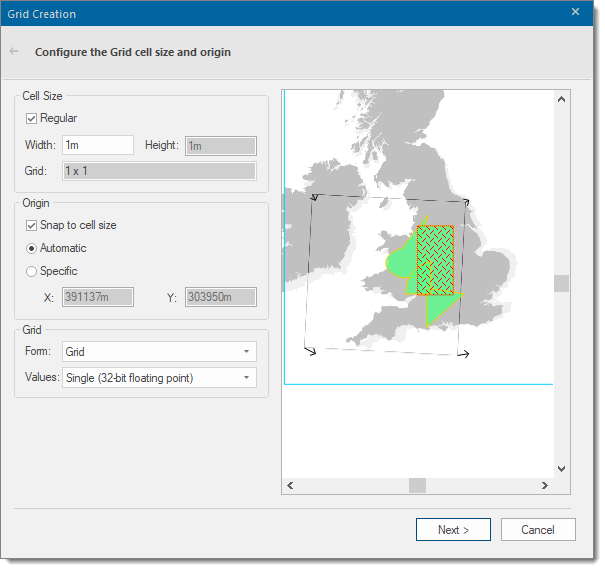
| Option | Description | |
| Cell Size |
Set the size of the Grid cells in metres. Uncheck the Regular tickbox to create rectangular grid cells. Else leave it ticked to produe square grid cells. TIP: Cell size is also known as grid resolution (Resolution property). The Grid size resulting from the Height and Width values is shown. |
|
| Origin |
Select Snap to cell size tickbox to round the X and Y co-ordinates so they are multiples of cell width and height. Select Automatic to automaticallyset the origin of the Grid. This is based on the extents of the selected data. Select Specific to make the X and Y values editable; this means you can manually specify the origin. |
|
| Preview window | Click inside the preview window and hold down the mouse middle scroll button to enable panning. Click and roll the middle scroll button to zoom. | |
| Grid |
Select an option from the Form drop-down menu to specify the type of grid. Select an option from the Values drop-down menu to specify the type of value. |
|
Smaller Cell Size values create a high resolution Grid but the Grid will take longer to generate. This in turn means clicking Next to progress through the dialog may take longer.
If the dialog fails to progress, the grid cell size is too small. Go back to Grid Creation and alter the grid cell size.
2. Click Next to open the Create Grid from Points dialog.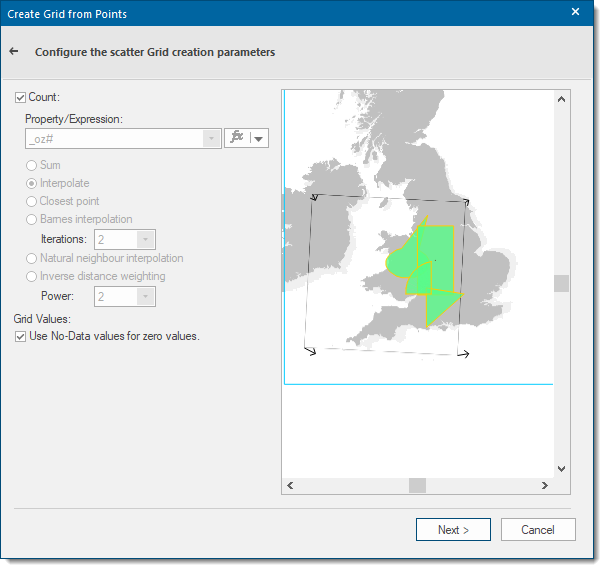
Note: This example SWD includes a schema called Pollution_Index&
Check the Count tickbox to create a Grid where each cell contains a value of the number of items (often points) contained within that cell.
Uncheck the Count tickbox to enable the Property/Expression field; this can be used with one of these four grid creation methods.
- Sum: The item property values within each cell are added together and stored within the corresponding Grid cell. Use this method if the property corresponds to a counted value (such as the population of a town) then you should pick the Sum method.
- Interpolate: The Grid cell values are interpolated from surrounding Point items. Use this method where the property gives a continuously varying measurement (eg height above sea level or pollution levels).
- Closest point: The Grid cell value corresponds to the value of the closest point. Use the Closest Point method if the property corresponds to a coded value (such as a code for land-usage).
- Barnes interpolation: Constructs a grid of size determined by the distribution of the two dimensional data points. Using this grid, the function values are calculated at each grid point. Use this method if f the property corresponds to a set of measurements of an unknown function in two dimensions, i.e. typically used in weather forecasting.
TIP: See Interpolation in SIS for a full description of the Interpolate and Closest point options.
Property/Expression: Press the fx button  to display the Pick a Property or Expression Builder dialog. Select either the Property or Expression to be used.
Use No-Data values for zero values: Check this tickbox to treat Grid cells containing zero values as 'No-Data'; this simply makes them hollow.
3. Click Next to open the style options.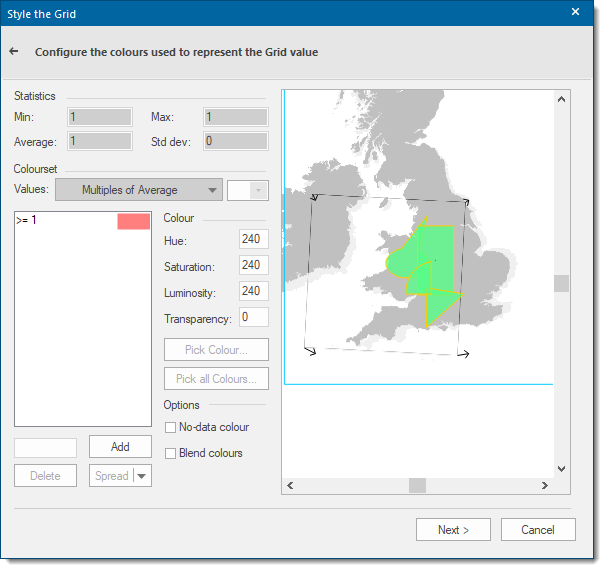
Statistics
This section gives an output of the Grid statistics which include Minimum and Maximum cell values, the Average cell value and the Standard Deviation of cell values of the grid.
Colourset Values
Select an option from the drop-down menu: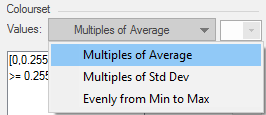
Multiples of Average: Sets the number of intervals according to the Grid cell Average. The range of each interval will equal the Average. With this option the Values drop-down box will be unavailable..
Multiples of Std Dev: Sets the number of intervals according to the Grid cell Standard Deviation. The range of each interval will equal the Standard Deviation. With this option the Values drop-down box will be unavailable.
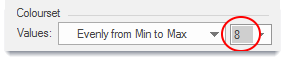
Evenly from Min to Max: Sets the intervals to equal sizes. The Values drop-down box will become active to allow you to select the number of intervals.
Note: Predefined coloursets can only be applied when less than 13 intervals are chosen.
Once the Colourset > Values selection has been made you can either click Pick Colour... to choose individual colours or click Pick all Colours... to pick a colourset.
 Displays the standard Windows Color selection dialog to allow a basic or custom colour to be selected.
 This button is active when Evenly from Min to Max is selected and has values between 3 and 12.
Pressing the Pick all Colours button will display the Pick Colours dialog which provides a number of predefined coloursets.
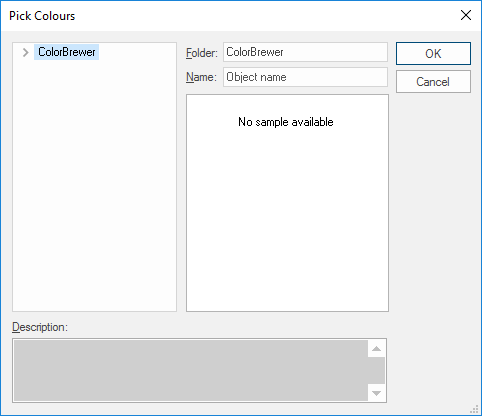
ColorBrewer can be expanded to show the predefined coloursets.
TIP: See also ColorBrewer.
If you have a range that contains data but is at a low level that you do not want to be visible in the Grid, select the range and set the value to fully transparent.
For example:
![]()
Colour
Hue (range 0 to 240) this is the wavelength of the colour. It corresponds to a position in a rainbow of colours. The value changes the colours from red (at 0) to green to blue and back to red (at 240).
Saturation (range 0 to 240) this is the purity of the colour. For e.g., pink is an unsaturated form of red. Primary colours are saturated, pastel colours are unsaturated.
Luminosity (range 0 to 240) this is the brightness of the colour. Very dim colours become black.
Transparency (range 0 for fully opaque to 255 for fully transparent) this value sets the degree of transparency.
A quick way of creating a new colourset is by changing the colour of the first and last intervals selecting all the intervals between and clicking Spread.
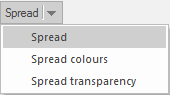
- Spread - spread colours and transparency
- Spread colours - spread colours only
- Spread transparency - spread transparency only
The first interval colour will be merged into the final interval colour across the selected intervals. E.g: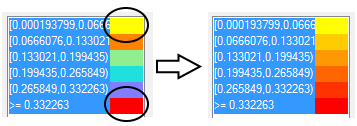
4. Click Next to open theReview the Grid dialog.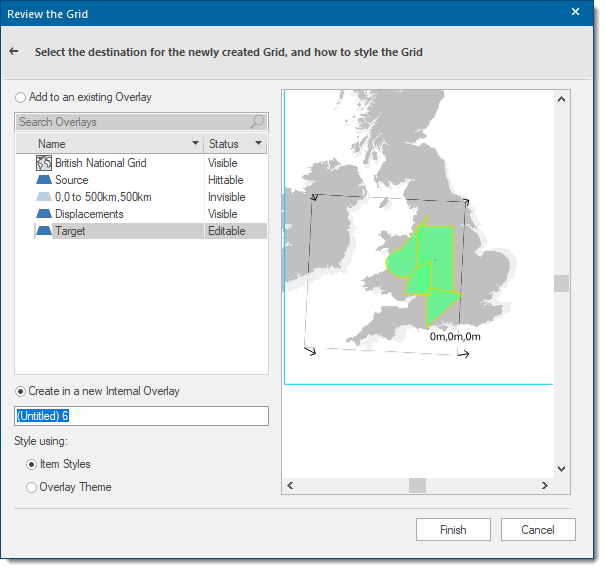
This allows you to select where the Grid item will be created.
Add to an existing overlay
To store the Grid item in an existing Overlay, select this Overlay in the Add to an existing Overlay pane.
Remember the Overlay’s status must be set to Editable and enabled to store Grid items.
Create in a new Internal Overlay
Alternatively you can select Create in a new Internal Overlay which will create the Grid item in a new overlay. Simply enter the name of the new overlay in the text box.
Style using
You can style the Grid using a Item Styles or apply an Overlay Theme.
On completion of the Review the Grid dialog click Finish to create the Grid item.
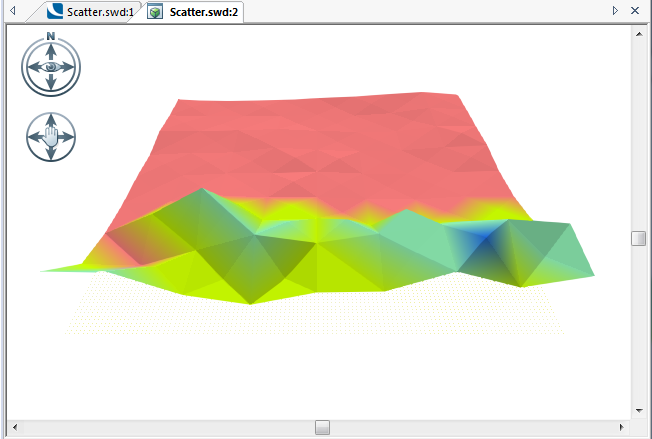
Example of a Grid item displayed in the 3D Window with height exaggeration 3D > Display > Exaggerate heights applied:
We recommend running the analysis initially several times, altering settings and styling, so that the created Grid is optimised for its purpose.
If the Grid is stored within an internal overlay it can be found under 3D as Grid:
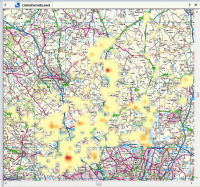
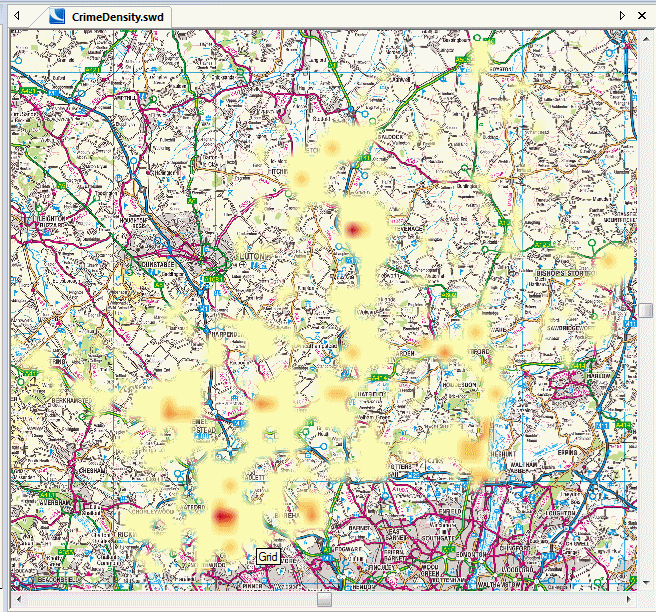
Example of a Grid showing crime hotspots:
The generated Grid is displayed below in 2D and overlaid on top of an ECW image.
If the Use No-Data values for zero values option (Create Grid from Points dialog) was selected, the “no-data” areas can be set to hollow showing underlying base maps.
This is done by selecting the Grid overlay properties.
- Press F2 to display the Overlays dialog:
- Navigate to the Styles tab > Edit Brush dialog, where the Brush is set to Hollow
- Select Override in the Overlays dialog - Styles tab.
- Transparency of the Grid can also be set in the Styles tab with the Transparency Overrides > Map Window Bitmaps slider.
The Grid can also be viewed in 3D to see trends easily and quickly.
To view in 3D ensure the overlay Brush property IS NOT set to Hollow.
Note: IIf there are problems viewing the grid, ensure that the projection/coordinates options are correct and that the grid is deselected. If you view your grid in 3D, you may find it does not look as you would expect, lowering the exaggeration to less than 1 may correct this.