Display Scale
SIS Desktop 9 uses the concept of scale to influence the way your spatial data (graphics), text and symbology are displayed.
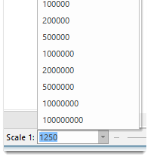
The Display Scale is seen in the Status Bar at the bottom of the Cadcorp SIS Desktop main window and changes as you zoom in or out.
All data in SIS Desktop 9 is stored in 'real world' sizes within a coordinate system. When data is displayed on screen, the real world sizes are shrunk to fit the computer monitor.
TIP: Because screen sizes differ the Display Scale shown is only an approximation. For example if you project a Cadcorp SIS Desktop map onto a large wall-mounted screen the Display Scale will be different to the Display Scale on a monitor.
There are many ways to select and adjust the Display Scale:
- Selecting a scale from the drop-down, as shown above.
- Moving the slider (to the right of the Scale 1: box) left to right to adjust the scale from small to large.
- Select Home > Zoom > Zoom To Scale and type the value into the Zoom to Scale dialog:
On some datasets you may have noticed all graphics are visible when zoomed in up close.
As you zoom out, smaller details progressively disappear. This is designed to speed up the display of very complex maps.
For example, if you are examining OS MasterMap data Cadcorp SIS Desktop might display only road centrelines, water features, railways and administrative boundaries when zoomed out.
Zooming in however could show building outlines, water features, pecked road metalling, etc. (but road centrelines are no longer displayed). Zooming in further reveals road names, house numbers and other smaller details.
SIS Desktop 9 uses real numbers throughout for scale thresholds typical of mapping scales. You can also enter any scale value you want.
Each map overlay displayed in a map window has minimum and maximum settings and the overlay is displayed on the screen only when the display scale is between these two settings.
The display scale at which certain data is filtered out is controlled by default settings.
You can override these settings, either for an entire overlay or for different features in the dataset.
- Open Home > Map > Overlays
- Navigate to Scale Thresholds on the General tab.
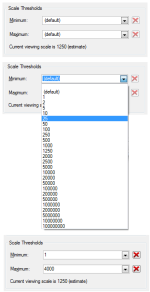
- Here select the minimum and maximum scale thresholds or enter your own values:

- The Minimum value indicates the lowest number (the largest scale) at which graphics should appear; the Maximum value indicates the highest number (the smallest scale) at which graphics will be displayed. To return the values to (default) click on the
.gif) button.
button.
When you set such an override, all data on the overlay is displayed according to the values you entered. This means that different display scales are no longer applied to the different features such as Road Centrelines, Building Outlines, etc.
By setting different display scale thresholds for different overlays, you can build window definitions (SWD files) in which the degree of detail or type of information displayed changes as you zoom in or out.
For example, imagine overlaid architectural plans of certain buildings (in a DXF file) onto your map base.
By setting a Maximum scale of 200 on the DXF overlay, you ensure this detail is displayed only when the view was zoomed in to a display scale larger than 1:200.
As you zoomed out to a scale smaller than 1:200, the DXF architectural data no longer appears and the map base is not cluttered by detail which is too fine to be of use.
Use this process to set the display scale of individual feature types. An example might be setting the display scale of Road Centre Lines so that they are shown at all scales.
- To find out the code of a feature, select the feature in the map window, right-click and select Properties.

-
Select the feature table you require, e.g. Topographic in the OS MasterMap folder in the (standard) library in the Libraries Control Bar.
-
Copy and paste the feature table into an editable library, for example the (temporary) library.
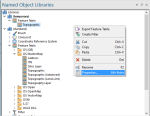
- Choose Properties from the local menu of this feature table:

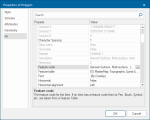
- This opens the Features dialog:

-
Select the feature code to which this filter should be applied.
For example to change the display scales at which Building Lines appear, select feature code 10017 from the drop-down list; to change the display scale of Building Text, select feature code 10020 etc. -
Change the Min Scale and/or the Max Scale as required.
- If you have a currently active dataset to which the new limits apply, you may need to redraw the map window to see the changes.
The changes made to the properties of this feature code are stored in the current library. Edit the feature code again by selecting it in the Libraries Control Bar.
