A symbol depicts a point item, therefore it is the point item which must be selected. Symbols cannot be selected by clicking on their component graphics. Select them either with the Point snapcode, or by a selection box around the point.
A symbol is displayed at the size it was created, if the scale of the dataset on which it was placed (the dataset scale) matches the viewing scale (the scale at which the map is being viewed at, found at the bottom right hand corner of the screen). Otherwise it will be displayed at a size proportional to the scale of the new dataset. A similar rule applies to printing: to print symbols at the size they were created, the printing scale (chosen in the Quick Print Template or the Print Template) must be the same as the dataset scale.
You can change the size of the symbol itself (without editing the symbol in the library) by changing its Scale property.
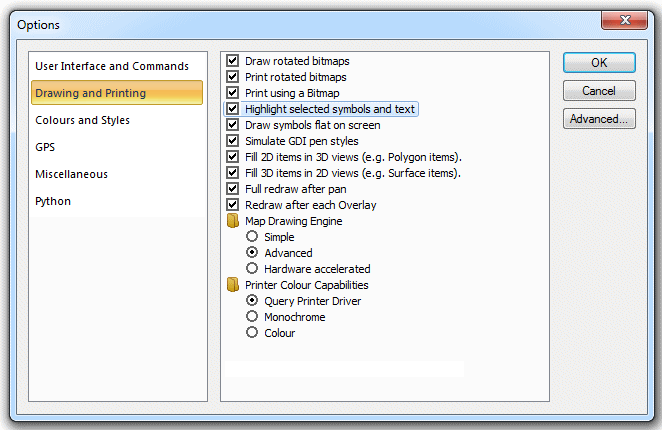
If you wish symbols to be drawn (in outline) while they are selected and being dragged across the display screen tick the Highlight selected symbols and text option in the Drawing and Printing tab of the Options dialog, see System Options.

You can easily replace one or more occurrences of a symbol, or different symbols, with another symbol.
Method 1
Use the Ribbon Format tab, Styles group, Symbol drop-down box.
For example if you have Points representing three groups of different trees; Trees.Tree 1, Trees.Tree 2 and Trees.Tree 3:
Select Trees.Tree 2 and Trees.Tree 3:
Go to the Format>Styles>Symbol drop-down and select Tree 4:
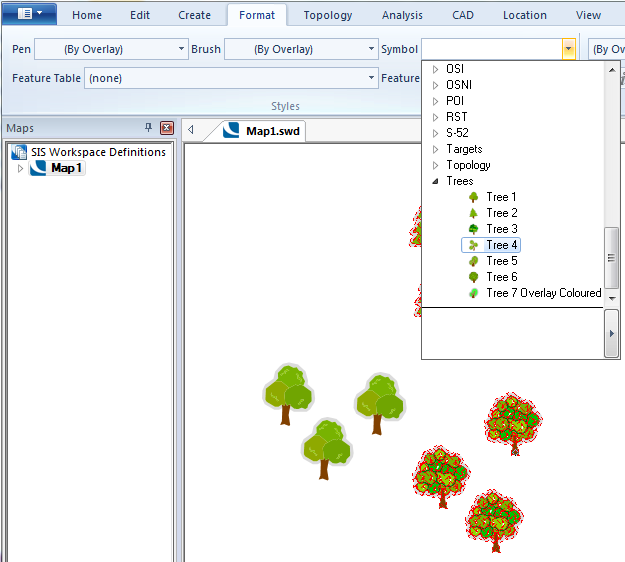
The selected symbols will change to Trees.Tree 4:
Method 2
Select Trees.Tree 2 and Trees.Tree 3, right-click and select Properties from the local menu:
The Properties of X Point item(s) dialog will be displayed:
Select Tree 4:
The selected symbols will change to Trees.Tree 4:
You cannot edit the graphics which make up the symbol. If you want to edit a symbol you must first explode it back into its constituent graphical items, edit the items, and then re-create the symbol (see Symbol [Create-Miscellaneous] for details of creating a symbol).
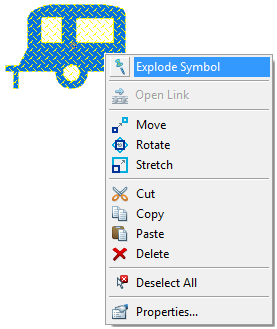
Use the point item’s local Explode Symbol command.
By clicking on a point and looking at its Origin properties, you can see its coordinates.
If you use Measure Position [Home-Measurement], you can see the point’s coordinates, measured from the projection origin and displayed in the current set linear units (set by CRS [Home-Map], Units tab):
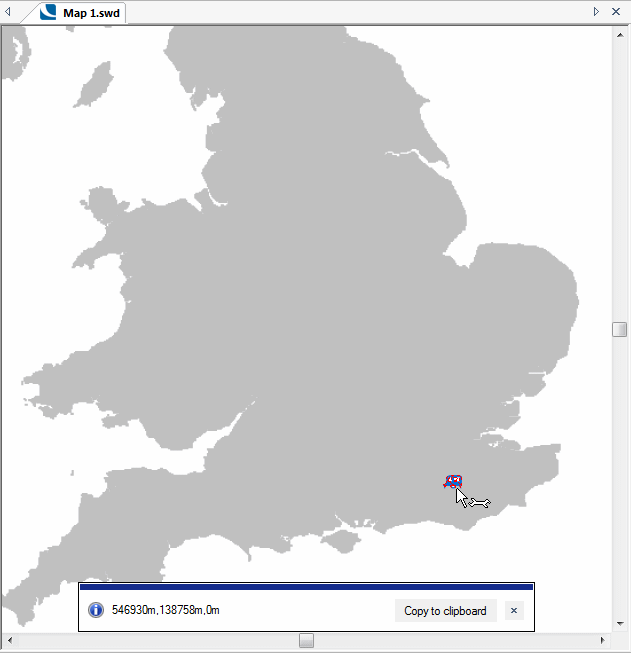
If you want to copy the coordinates click Copy to clipboard.
A symbol is displayed at the size it was created, if the scale of the dataset on which it was placed (the dataset scale) matches the viewing scale (the scale at which the map is being viewed at, found at the bottom right hand corner of the screen). Otherwise it will be displayed at a size proportional to the scale of the new dataset.
A similar rule applies to printing: to print symbols at the size they were created, the printing scale (chosen in the Quick Print Template or the Print Template) must be the same as the dataset scale.
You can change the size of the symbol itself (without editing the symbol in the library) by changing its Scale Value in the All tab of the Properties of Point dialog.
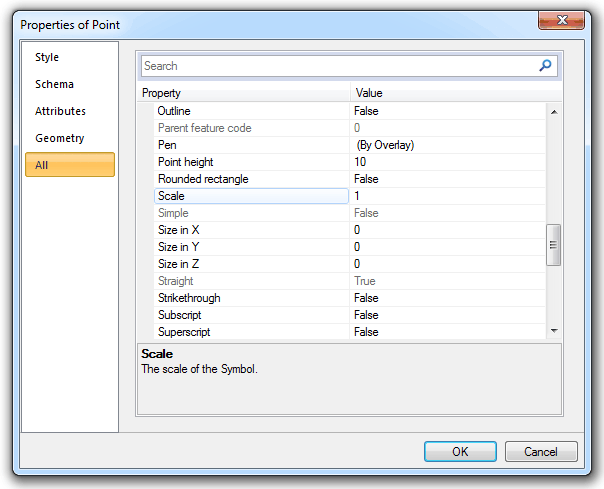
If the symbol has not previously been scaled, the Scale value will be 1. Type in a new value:
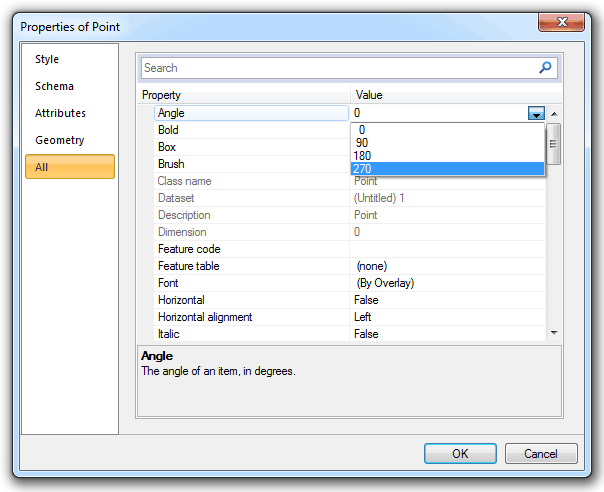
You can rotate a symbol by setting its Angle property.
You must specify the required total angle of rotation in an anticlockwise direction.
For example, to change the rotation angle of a symbol from 45 degrees to 60 degrees, enter 60.
Send comments on this topic.
Click to return to www.cadcorp.com
© Copyright 2000-2017 Computer Aided Development Corporation Limited (Cadcorp).