Open an SWD of your map data, or create a new map window and add the overlays of the map data to be plotted. Use the Map Modeller's viewing tools to zoom to the area of mapping to be plotted.
For example, choose an area of about 2km x 2km (a display scale of about 1:8000 depending on your screen resolution).
If your map includes GB Ordnance Survey LandLine or MasterMap data, you may find that the scale thresholds prevent all of the data from being displayed. Do not be concerned; Book Plotter will include all the map data appropriate to the display scale of each page.
Open the Applications ribbon tab and select Book Plot:
The Select the spatial content for this book of plots dialog will be displayed:
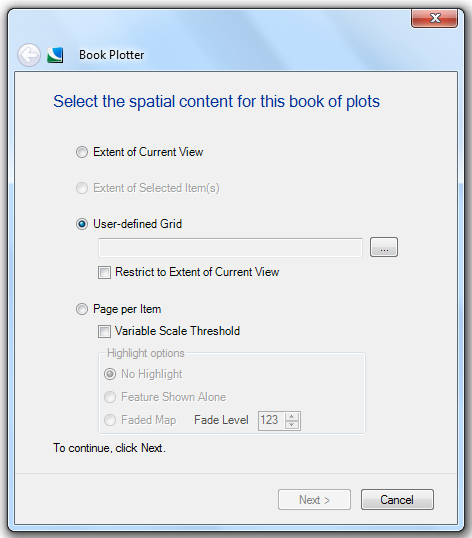
The above dialog allows you to control the map extents and offers four options as follows:
Extent of Current View
The simplest way to define the extent of mapping to be plotted is to zoom to the area in the Map Modeller map view. Map Modeller users will know that when they zoom to a long, thin rectangular area, the map view displays this area and 'pads' the current window with the surrounding mapping to fill the proportions of the current view. It is this 'padded' extent which will be treated as the extent when using Book Plotter. In other words, 'what you see is what you get' (WYSIWYG).
If you zoom to the full extent of map that you want to plot as pages, it is quite likely that scale thresholds will suppress the display of some map features in your map view. As Book Plotter pages are produced, the scale thresholds applicable to the scale of the plot will apply, so you will see the full detail on each page. Check this when the first preview plot is displayed. Remember WYSIWYG!
The Extent of Current View topic describes the subsequent dialogs for this option.
Click here for an example of Extent of Current View.
Extent of Selected Item(s)
Sometimes you may want to produce a book of plots to cover the extent of a chosen selection of map features. For example, you may have used Map Modeller to select all addresses which have responded to a questionnaire, and want to produce a book of maps for market researchers to follow up by visiting these addresses. If these addresses are displayed as a 'View Points' dataset, you can use the SIS Selection command (Home tab-Zoom group) and use Extent of Current View or Extent of Selected Item(s) to produce a book of plots of this selection without the need to display them all.
Note that the pages of the book will cover the entire rectangular extent of the selection, so there may be pages which do not contain any selected items at all.
The Extent of Selected item(s) topic describes the subsequent dialogs for this option.
Click here for an example of Extent of Selected Item(s).
User-defined Grid
Although the four rectangular extent options are useful, it is possible that you will want to produce Book Plots of an area which is not rectangular. Book Plotter enables you to define your own matrix of pages which only includes the map features which are relevant to you. You may also set the page referencing to your own labelling system. For example, rather than pages being referenced as 1, 2, 3, etc. you may use a lettered system like A1, A2,…B1, B2, etc.
If you have created a User-defined Grid you can select the ... button and browse to this grid as the area of mapping to be plotted. A user-defined grid is a set of identically-sized non-overlapping rectangles which cover your area of interest. Overlapping of adjacent pages is taken care of automatically if the Overlap % is set in a subsequent Book Plotter dialog.
If you want to use a User-defined Grid you can still restrict printing to pages which fall within the current view extent by checking the Restrict to Extent of Current View tickbox.
The User-defined Grid topic describes the subsequent dialogs for this option.
Click here for an example of a User-defined Grid.
Note: Full details of creating User-defined Grids can be found here.
Page per item
The Page per Item option allows you to print each item in a dataset or selection and suppress all other items on the same overlay.
You can specify one or more overlays to be considered. Book Plotter will then produce a book page for each item found on the nominated overlays. It will automatically adjust the scale of each plot to completely encompass the item, with an optional percentage margin specified using the Overlap % setting. If any items are single points (symbols) which do not have a physical extent, the book page will be produced at the scale set as in the other methods.
This option may be useful in producing a set of pages showing each parish in a county, the scale being sufficient in each case to show the whole parish irrespective of differences in size between them.
If you want to maintain the Scale thresholds that you have applied to the overlays in your SWD check the Variable Scale Threshold tickbox.
Highlight options
No Highlight
No highlighting to be used.
Feature Shown Alone
Will suppress all items on the Page per Item overlay other than the one for the current page.
Faded Map
Everything is faded except the item for the current page. Fading is achieved by adding a transparent white overlay.
Fade Level
This is the transparency of the white brush, select 0=fully opaque, 255=fully transparent)
The Page per item topic describes the subsequent dialogs for this option.
Click here for examples of Page per item.
When the selection is made click Next to continue.
The next dialogs to be displayed depend on the selection made in the Select the spatial content for this book of plots dialog.
Send comments on this topic.
Click to return to www.cadcorp.com
© Copyright 2000-2017 Computer Aided Development Corporation Limited (Cadcorp).