Kernel Density Estimations (KDE) (Point densities/Probabilities)
Spatial analysis is a computer based technique for the investigation and selection of locational entities using their topological, geometric, or geographic properties.
Spatial analysis techniques are composed of statistical algorithms, topological functions, and Boolean tests.
Spatial analysis processes in SIS allow for questions such as:
SIS orders the different spatial analysis methods in groups which are accessible through the analysis tab from the SIS ribbon interface.
Boolean operations allow SIS to investigate the spatial relationships of two or more simple geometries. The result of a Boolean operation is either a single or multi-geometry. Boolean operations allow the union of multiple geometries into a single geometry item, cookie cutting a single intersection item, subtracting multiple geometries from a single geometry, or keeping the symmetric difference between the union and the intersection of the same geometries. Furthermore it is possible to dissolve (union) geometries based on their associated attribute values.
The following example shows a Boolean intersection:
Spatial buffers are newly created geometries based on a buffer distance, a mode, and the geometric shape of the item or group of items which is buffered. The buffer mode defines whether a buffer extends the exterior of the selected geometry, creates an interior, or extends from the boundary geometry. Newly created buffers can be either Polygon or QZone items.
The following example shows an outside mode buffer:
Thiessen polygons (also known as Voronoi, or Dirichlet cells) can be generated from a group of point items. A Thiessen polygon is bounded at the intermediate distance between a point and its neighbours.
The following is an example of Thiessen polygons:
Scatter gridscan be used to interpolate a continuous surface from values at distinct locations. According to Tobler’s first law of geography "everything is related to everything else, but near things are more related than distant things"(Waldo R. Tobler, 1930). Physical as well as social properties can be modelled into continuous surfaces. A heat map for example is an interpolated temperature surface based on discrete temperature measurements at weather stations.
KDE (Kernel Density Estimations) Hot Spotsare modelled surfaces which describe the spatial distribution of point locations. A hotspot map can describe the relative, or absolute distribution of point events or their probability. Hot spot maps are useful for investigating the distribution patterns and their underlying causes in large record datasets (e.g. crime, fire, health).
Other grid analysis tools allow the creation of slope and aspect grids, and the subsequent investigation of viewsheds.
Grid expressions can be used to combine grids and draw conclusions on a relationship between model surfaces.
Topological networks can be used to investigate the shortest route between two points, or the iso-routes from set locations. Iso-routes are particularly useful for investigation of an area of effect within a network (e.g. store locations, emergency response times). SIS can read topographic datasets such as the OS MasterMap Integrated Transport Network (ITN), or can create its own topological connectivity.
SIS features additional tools for querying or filtering spatial datasets.
Boolean algebra (or Boolean logic) in SIS is a logical check of the spatial relationship between different simple geometries. SIS is able to test groups which contain area, line, and point geometries.
All Boolean operations in SIS result in a single or one multi-geometry item. If the items in the test group have different attributes, SIS will prompt for the item whose properties should be retained.
Boolean logic is based on the basic operations, namely conjunction (Intersect), disjunction (Union), and negation (Subtract).
A Boolean disjunction (Union) is true for all geometries contained in the test group. The resulting item will be either a single geometry (where the same geometry types can be merged) or a multi-geometry (when the geometry elements are spatially separated or different geometry types have been tested together).
A Boolean conjunction (Intersect) is based on the logical AND statement. A spatial union will create a new geometries whose extent is the geometric intersection of all items in the test group. In a test group containing the areas A, B, and C, only the intersection of all three areas will become the product of the Union operation. Where only two of the three areas intersect, the Boolean conjunction is not true.
SIS requires the selection of a single item for the Boolean negation (Subtract). The geometries of all other items in the test group will be subtracted from this geometry.
Symmetric Differenceis a special operation derived from basic Boolean logic. The resulting item geometry is the product of all geometries which do not intersect, or where more than two geometries from the test group intersect.
The following figure shows Boolean operations in SIS:
A = Union
B = Intersection
C = Subtract
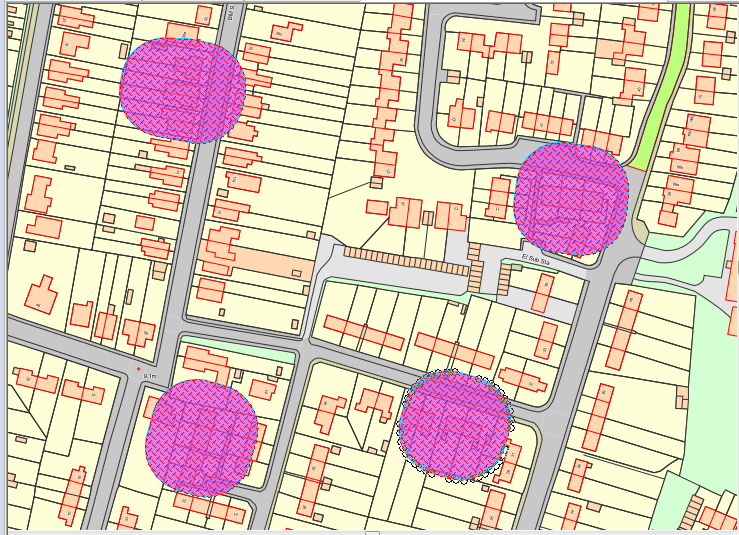
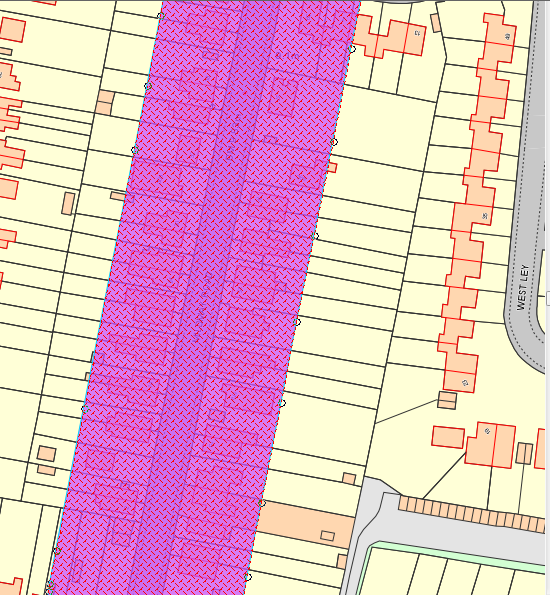
A buffer is a zone of a user-specified size around selected items. For example, you can use buffers:
The example below shows 20m buffers around four different addresses.
This example shows a buffer 25m either side of a main road:
A buffer can be either a Polygon buffer or a QZone buffer:
Buffers are created in the current axes projection. This could lead to a new Internal dataset being created, if no editable datasets exist with the same projection.
Thiessen polygons (also known as Voronoi, or Dirichlet cells) can be generated from a group of point items. A Thiessen polygon is bounded halfway between neighbouring point items.
Thiessen polygons can be used for zonation based on the discrete locations in a point dataset. Polling stations, fire brigades, or police stations for example could be used as input dataset with the resulting Thiessen polygon layer describing the zone of influence for each station.

Thiessen polygons can be created by selecting two or more point geometries and selectingThiessen Polygons [Analysis-Buffer]. For other geometry types centroids are used as input locations. The Thiessen polygons will be created on the current overlay. If the current overlay is not editable, a new internal overlay will be created.
Scatter Grids can be used to interpolate a continuous surface from values at distinct locations. According to Tobler’s first law of geography "everything is related to everything else, but near things are more related than distant things" (Waldo R. Tobler, 1930). Physical as well as social properties can be modelled into continuous surfaces. A heat map for example is an interpolated temperature surface based on discrete temperature measurements at weather stations.
The Scatter Grid [Analysis-Grids] command Create Grid from Points dialog allows for the definition of a mode for the calculation of grid values (Sum, Interpolation, Closest point or Barnes interpolation), as well as the definition of the extent and resolution of the resulting model surface.
SIS will apply a linear interpolation to determine grid cell values from the input dataset.
SIS Kernel Density Estimations (KDE) allows the modelling of a continuous surface from discrete event points. Unlike the scatter grid, the KDE surface elevation will not describe a z value which is interpolated from a series of survey points.
Note: Also see the KDE Hot Spot [Analysis-Grids] command.
A KDE model surface describes the relative density of point events. Density and distribution patterns can be used in the investigation of underlying causes. The first notable application of this theory being the investigation of cholera in London (1854), with the pattern leading to the identification of a sewage-polluted well on Broad Street as a possible cause for the outbreak (John Snow, 1813 – 1858).
C.F. Cheffins, Lith, Southhampton Buildings, London, England, 1854 in Snow, John. On the Mode of Communication of Cholera, 2nd Ed, John Churchill, New Burlington Street, London, England, 1855.
In forecast and planning applications, KDE is used to determine probabilities. KDE is a proven technique in social and physical sciences and is used for example for the investigation of geological events (e.g. earthquakes, volcanic plumes), health (disease), and crime (theft, burglary).
SIS applies a kernel on each point location from the input data series to determine the relative point density. The shape and bandwidth of the analysis kernel is user defined and will determine the coarseness and modality of the KDE model surface. Different kernel shapes will have much less impact on the analysis result than a change in bandwidth.
The different kernel shapes which are available in SIS are:
|
Normal Distribution (Gaussian)
|
 |
| Quartic (Spherical)
|
_513x382.gif)
|
Negative Exponential
 diagram1.gif)
|
|
|
Negative Exponential (bounded)
|
_513x377.gif)
|
|
|
_514x376.gif)
|
|
|
_506x372.gif)
|
|
|
_502x374.gif)
|
|
|
_492x362.gif)
|
|
|
|
A kernel is a non-negative real-valued integrable function K satisfying the following two requirements:
If K is a kernel, then so is the function K* defined by K*(u) = ?-1K(?-1u), where ? > 0. This can be used to select a scale that is appropriate for the data.
1{…} is the indicator function.
More important than the kernel shape is the kernel bandwidth. A higher bandwidth will result in a smoother uni-modal surface where detail might be lost. A small bandwidth results in a multi-modal surface which is too coarse for the investigation of underlying phenomena.
The SIS KDE tool provides the option to define the kernel bandwidth based on the k-mean nearest neighbour distance of the input dataset. The best fit k is dependent on the number of locations and their distribution pattern. A k between 1 and 10 is often appropriate. It is recommended to run the analysis several times and conduct a visual check of the KDE analysis surface.
Sample KDE (k = 10) resulting in a surface which is too smooth for an analysis:
Sample KDE (k = 5) resulting in a good model surface.
Sample KDE (k = 1) resulting in a coarse, ridged, model surface.
Events in the incident dataset can be weighted for the KDE analysis. If a weight is applied to the dataset it is assumed that certain points are more important for the analysis than other points. A crime dataset which has been filtered for social unrest and number of arrests per incident could be used to investigate causes of social unrest. In this case the number of arrests can be used to weight the discrete incidents in the dataset.
KDE weighting must not be confused with scatter grid interpolation. In the above example an interpolated surface would indicate many arrests close to a recorded incident with multiple associated arrests. KDE will regard an event with a weight of 3 like 3 individual events with a weight of 1 each.
KDE for exampleis used in earth sciences to determine volcanic hazard. Volcanic hotspots are monitored via the MODISsatellite platform. The data is processed and made available through MODVOLC at the University of Hawaii. The hotspot data can be download as a comma separated CSV file which SIS is able to display as a View Points overlay in the Lat/Lon WGS84 map projection.
Due to the nature of volcanic hotspots a negative exponential kernel is suitable for the KDE analysis.
An initial visual interpretation has determined that a k-mean nearest neighbour distance from 10 points (0.097°) is a good fit for the kernel bandwidth.
Volcanic hotspots can be weighted according to the measured magnitude of the hotspot event.
Based on the spatial extent of the input dataset a resolution was chosen which results in a moderately sized grid (500k+ cells).
SIS can be used to create a two-pair colour-set. The min and max grid values are assigned in the colour-set. Intermediate values can be blended for a smooth graphic representation.
Applied to a record of volcanic hotspots for Distrito Federal, Mexico (2009-2010), the KDE surface can be exported from SIS as raster file and overlaid to the topographic base data in Google Earth. This visual interpretation clearly identifies the active volcano Popocatepetl, south-east of Ciudad Mexico.
KDE analysis of volcanic hotspots in Mexico:
©2010 Google Earth
Send comments on this topic.
Click to return to www.cadcorp.com
© Copyright 2000-2017 Computer Aided Development Corporation Limited (Cadcorp).
 formula.gif)
 diagram.gif)
 diagram2.gif)
 formula.gif)
 diagram.gif)
 formula.gif)
 diagram.gif)