Grid From Expression
Grid From Expression creates a Grid item from an expression involving other named grid items. This operation is sometimes called Grid Analysis.
The input grid items can be created using commands such as Scatter Grid, Hot Spot and Convert to Grid.
They can also be saved in a Named Object Library using Store Item and recalled using Recall Item.
Grid From Expression cannot technically CREATE a grid; it can only be used to transform existing grids. It will not work with Polygon-based grids such as the one created by KDE - Hexagonal/Rhombic/Circular or by any of the Tessellate process operations.
Select Analysis > Grids > Viewshed..png)
This opens the Map Algebra window:
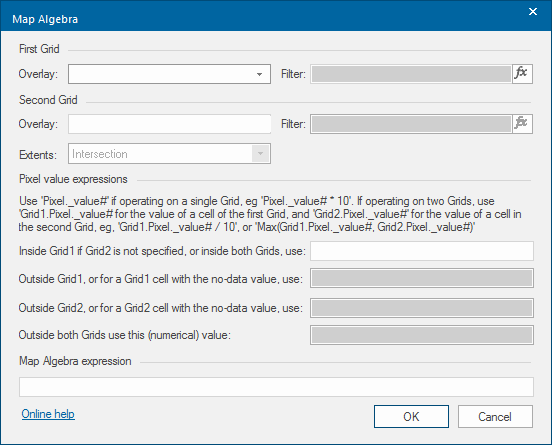
Use this dialog to take in one or two Grid items as inputs and return one Grid item as an output.
Remember you cannot create or name a new overlay for the output grid.
To output the grid to a separate overlay:
- Create a new overlay (bds, internal dataset, etc).
- Right-click this overlay and select Make Current.
- The resulting grid will be output to this overlay.
- If there is no Current overlay, the resulting grid will be output to the first editable overlay (if there is one) or a new Internal Dataset overlay will be created for the resulting grid.
Overlay: Select the desired overlay from the drop-down menu.
Filter: Use this optional parameter to select the desired grid item from the overlay to perform the analysis on (ie if the overlay has multiple items, you can select by ID).
If multiple grid items are left when the overlay has been filtered, the Grid From Expression will only use the first one selected. It cannot be used to carry out calculation on more than two grids at a time
The Filter option cannot be used to filter the grid based on pixel value (ie ‘select all of the grid that is below 100m etc.), it cannot get the Pixel._value$ variable in the expression builder. The easiest way to do this is with an iif statement in the Pixel value expressions section, detailed below.
Overlay: Select the second overlay from the drop-down if required.
Extents: Select the type of extent calculation:
|
Option |
Description |
|
|
Intersection |
Only calculates results in grid space common to both input grids (ie where they intersect) Example Map Algebra expression for the Intersection extent function: MapAlgebra(FindGrid(Overlay("grid1")),FindGrid(Overlay("grid2")),
{Grid1.Pixel._value#},ET_Intersection,{Grid2.Pixel._value#})
|
|
|
Union |
Calculates results in all grid space common to at least one of the input grids (ie as if joined by the Union tool) Example Map Algebra expression for the Union extent function: MapAlgebra(FindGrid(Overlay("grid1")),FindGrid(Overlay("grid2")),
{Grid1.Pixel._value#},ET_Union,{Grid2.Pixel._value#},{Grid1.Pixel._value#})
|
|
|
First grid |
Calculates results in grid space of first grid only - any values in the second grid outside this area are ignored Example Map Algebra expression for the First grid extent function: MapAlgebra(FindGrid(Overlay("grid1")),FindGrid(Overlay("grid2")),
{Grid1.Pixel._value#},ET_First,{Grid2.Pixel._value#})
|
|
|
Secondgrid |
Calculate results in grid space of second grid only - any values in first grid outside this area are ignored Example Map Algebra expression for the Second grid extent function: MapAlgebra(FindGrid(Overlay("grid1")),FindGrid(Overlay("grid2")),
{Grid1.Pixel._value#},ET_Second,{Grid2.Pixel._value#})
|
|
Use 'Pixel._value#' if operating on a single Grid, eg 'Pixel._value# * 10'.
If operating on two Grids, use 'Grid1.Pixel._value#' for the value of a cell of the first Grid and 'Grid2.Pixel._value#' for the value of a cell in the second Grid, eg, 'Grid1.Pixel._value# / 10', or 'Max(Grid1.Pixel._value#, Grid2.Pixel._value#)'.
- Inside Grid1 if Grid2 is not specified, or inside both Grids, use: - Specifies the value for where both grids overlap (or for how to modify the first grid if only one is specified).
- Outside Grid1, or for a Grid1 cell with the no-data value, use: - Specifies the value for every point at which Grid2 has a value but Grid1 does not.
- Outside Grid2, or for a Grid2 cell with the no-data value, use: - Specifies the value for every point at which Grid1 has a value but Grid2 does not.
- Outside both Grids use this (numerical) value: - Specifies the value at the points at which neither input grid has a value (but are still within the extents of the new grid)
As values are selected in the Pixel value expressions boxes, the Map Algebra expression field is updated.
You can edit this expression directly rather than filling in the dialog boxes. This will affect the result but will not change the values currently entered in the dialog boxes.
If you edit an expression and then edit one of the dialog boxes, the Map Algebra expression will be rebuilt and any changes lost.
See the following example where the Map Algebra dialog is set as below:
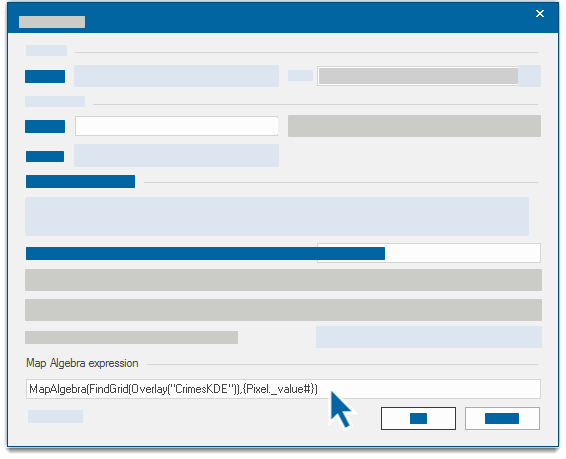
If the Map Algebra expression is changed to: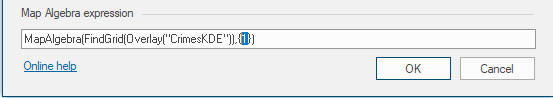
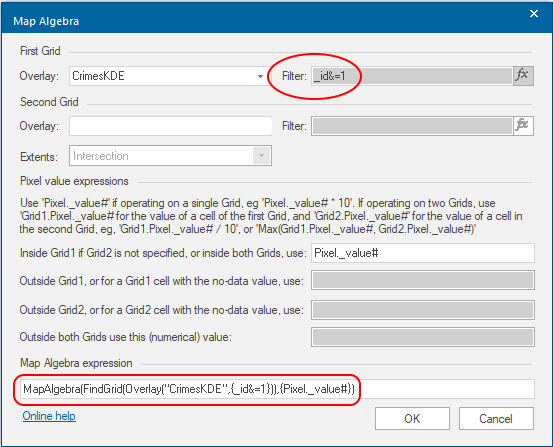
If a change is then made to the dialog boxes (in this case to add a filter to the first overlay _id&=1), the initial change made will not be saved (ie the ‘1’ will change back to ‘Pixel._value#’)
On completion of the Map Algebra dialog click OK.
The resulting grid will be shown in the first Editable overlay available. If no overlays are Editable the result will be created in a new overlay: 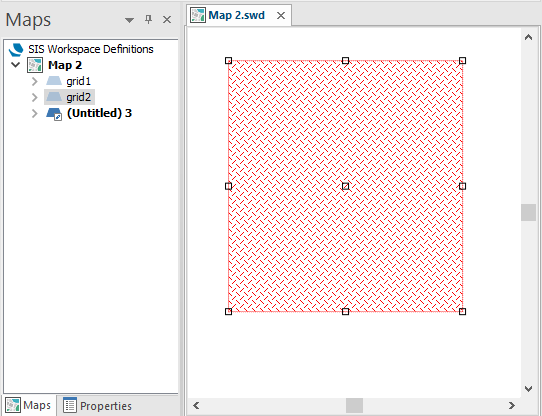
Now you can publish the grid/overlay to other layers etc., or use it as the input for another Map Algebra expression for further calculations.
The output grid can be saved in a Named Object Library using Create > Miscellaneous >Store Item.
You can also right-click on the grid for a range of options:
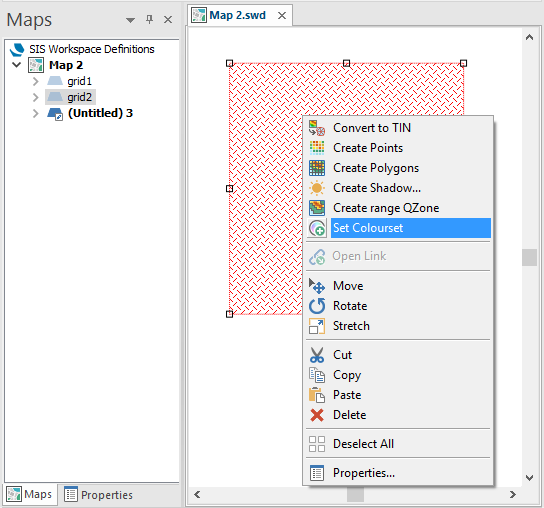
The local menu options are:
- Convert to TIN - Converts the grid into a TIN item.
- Create Points - 'Explodes' the grid into one Point item per grid cell.
- Create Polygons - 'Explodes' the grid into one Polygon item per grid cell.
- Create range QZone - Creates a QZone item covering the pixels in the grid which have values in a chosen range.
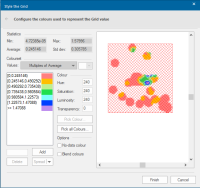
- Set Colourset - Selecting Set Colourset will display the Style the Grid dialog (see Scatter Grid for a description of styling a grid) to allow you to configure the colours to represent the grid:

To see grids in action, see the Cadcorp Community pages. The example shown uses grids to identify high risk areas. (You need a user account to access Cadcorp Community).