
Creating Symbols in a Named Object Library
Points usually have a symbol assigned to them. A symbol is a pre-defined "graphic". SIS provides a number of pre-defined symbols which are named objects stored in the (standard) library. You can also create your own symbols, which can consist of any group of LineString, Polygon, bitmap, or box text items.
Points can also be seeds for Polygons and TopoLineString items, see Topology.
See Point [Create-Simple] for details of creating Points and assigning Symbols.
A multi-point item is a single item consisting of more than one point, all the constituent point items having the same symbol and style. You can create a multi-point item by first selecting a point item, then using Add Geometry [Create-Edit] to add further points to it.
A multi-point item can be manipulated as a single item. The symbol used to display the points in the multi-point item is that of the original point item (the one to which other point items were added).
A symbol may consist of any combination of LineString items, Polygon items, box text and bitmaps (but not point text and topological structures; although you can use these items, they will not be displayed). You can create symbols using Map Editor and Map Modeller.


When symbols are drawn on Points, the levels are added together. SIS will only draw levels between 0 and 255. If the total of the levels is greater than 255 the symbol is not drawn.
When arriving at a total number for the levels each individual layer of the Symbol is taken into account.
The following examples illustrate this:
It is recommended that items making up a symbol are set to a low level to avoid the possibility of all, or part, of the symbol not being displayed.
To ensure the Symbol is displayed at the correct scale set the _pointScaleOverride# property to -1, this is described in Fixing the Symbol size.
Symbols can be extremely complex objects, making extensive use of the advanced capabilities of SIS such as scale thresholds and levels. For example, it is possible to create symbols which appear differently at different scale thresholds.
Ordnance Survey files contain locations for symbols of ordnance benchmarks, pylons, flow arrows, etc. These Ordnance Survey symbols are stored with appropriate names (e.g. Bench Mark, Pylon, Flow Arrow) in the OS DNF, OS NTF and OSNI NTF folders in the (standard) library.
Note: Make sure that the Brush is set to Blank to make transparency work.
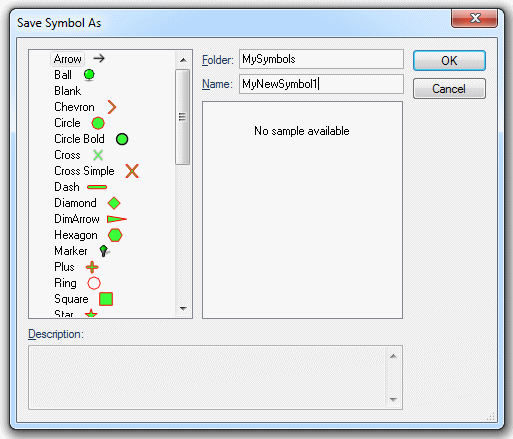
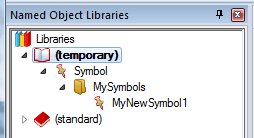
To create a Symbol in a Named Object Library:
When you place a copy of a Symbol using a Point item there is an interaction between the properties of the Point item and the properties of the item(s) which define the Symbol. In general the properties of the item take priority, unless they are undefined. Properties that act in this way include Pen, Brush, Minimum scale, and Maximum scale.
This means that if the original items have the "(By Overlay)" Pen, then they will be drawn in the Pen of the Point item. But if the original items have their own Pen objects, then the Pen of the Point item will be ignored. If the Pen objects of the items are mixed between "(By Overlay)" and other Pen objects, then the effect of changing the Point item’s Pen will be to partially change the Pen objects used to draw the Symbol.
The Level of the original items determines the drawing order of the components of the Symbol every time it is drawn. This means that you can define a Symbol made up of Polygon items that use opaque Brush objects. By carefully setting the Level of the Polygon items you can ensure that you get the overlapping effect that you want. Using Polygon items (or Bitmap items) in Symbol objects is especially useful for symbols that stand out, e.g. for Command and Control type applications.
This is similar to setting the (By Overlay) symbol (see above), except that this procedure makes all points on the overlay use the selected symbol, not just those which use the (By Overlay) symbol.
All Symbol objects are defined in Named Object Libraries using paper units. That means that they know how big they should be printed on paper, and their size on screen must be recalculated each time they are drawn.
When you create a Symbol the current viewing scale is used to convert the items from world units into paper units. Then when you place Point items which use that Symbol, the Point item’s dataset scale is used to convert from paper units back to world units. The net result is that the placed Symbol objects appear the same size as the original graphics unless the dataset scale is different to the original view scale.
You can modify the size of a Symbol, by setting the Scale property, which has a default value of 1 (one).
By default SIS assumes that you will print the current SIS Workspace Definition (SWD) onto paper at the current viewing scale, so it shows you how big the Symbol objects will be relative to other graphics (like roads and buildings). This means that the Symbol objects will change size on screen as you zoom in and out.
However, some applications are more interested in how the graphics appear on screen than on how they will appear on paper. An example is a Command and Control system where moving objects like cars are tracked on screen. In this case you can use a negative Scale. A Scale of -1 will cause the Symbol to be drawn at its Named Object Library size on screen, regardless of how much you zoom in or out.
When the effective viewing scale is the same as the dataset scale, a negatively scaled Symbol will appear the same as a positively scaled Symbol (so -2.5 would be the same as +2.5).
Send comments on this topic.
Click to return to www.cadcorp.com
© Copyright 2000-2017 Computer Aided Development Corporation Limited (Cadcorp).